When you use a column of type text as a measure in a pivot query, which of the following pivot functions are available? Note: There are 2 correct answers to this question.
You need to create a chart of type Indicator: Numeric Point that displays the following output:
count of employees with the gender male divided by the count of employee with the gender female.
The chart can then be filtered for different departments. What calculation is required to create the metric?
What are the requirements for a custom block in People Profile to be reportable in a Story? Note: There are 2 correct answers to this question.
Which are valid destinations of a scheduled Report Distributor bundle? Note; There are 3 correct answers to this question.
When you share a tile, how can the user view that tile? Note: There are 3 correct answers to this question.
You want to create a tile-based dashboard and make it available to users. After you created and named the dashboard, which steps are required?
You are using a Multi-Dataset table report without Business Intelligence Reporting Tools (BIRT). What are characteristics of the report output? Note: There are 2 correct answers to this question.
Why would you export report definitions? Note: There are 2 correct answers to this question.
If you want to create a single filter that utilizes criteria from multiple tables in the same query, which filter do you need to use in Query Designer?
A report consumer claims that a canvas report shared with them is NO longer available in Report Center. Upon your investigation, you find the report has been deleted. You need to reproduce the report as quickly as possible. What action do you take?
In Query Designer, you are trying to create a conditional expression to relabel a field. You create the following expression: IF([User#Basic User Information#Gender] = "M" , "Male" : "Female") You received an error message saying the formula could NOT be computed. Which symbol in your expression is causing the error?
You are creating a Story report on employment and compensation information. You have created two queries to support the story report. The table and the left chart are using an employment query as its data source. The right chart uses a compensation query as its data source. Both queries include the field for the employee Job Title. When you add an input control to the page, it only filters the table and the left chart. What action must you take to configure the input control to effect both charts and the table?
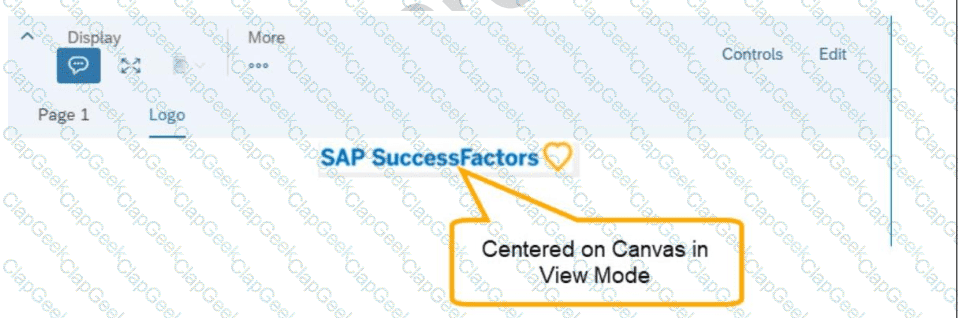
You are configuring a story report. You add the image widget to the top-left corner of the canvas. You then upload the SAP SuccessFactors logo in the Builder, and select the logo image so it displays on the canvas. When you preview the report in View Mode, the logo appears centered on the canvas. What action do you take so the Logo appears in the top-left corner when viewing the report in View Mode?
You want to create a page in a canvas report that includes a custom image, a user editable title centered underneath the image, and the current date in the top-right corner. Which combinations of components can you use to accomplish this? Note: There are 2 correct answers to this question.
What provisioning setting must you enable to allow customers to upload a custom BIRT template to a Table Report?
You create a report page and want to change the grid column width and grid row height of the Page Designer. Where can you do this?
You have created a custom MDF object to track company car information. You need to be able to create story reports on the data of the custom MDF object. What must you do to enable a custom MDF object to be listed in the Available Data section of Query Designer?
You are working with nested labels on your instance in Report Center.
How do you configure the labels as displayed in the screenshot? Note: There are 2 correct answers to this question.
What features are available only when you use Business Intelligence and Reporting Tools (BIRT) with Table Reports? Note: There are 2 correct answers to this question.


TESTED 02 Jan 2026