A client calculates the percent of total sales for a particular region compared to all regions.
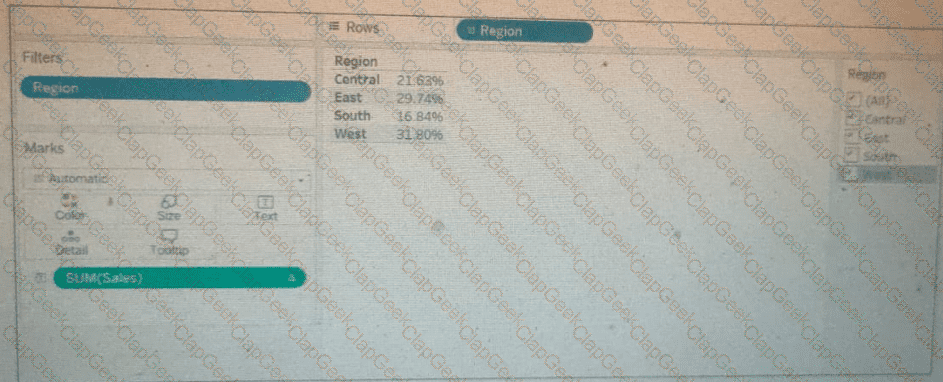
The Sales percentage is inadvertently recalculated each time the filter is applied to the Region.
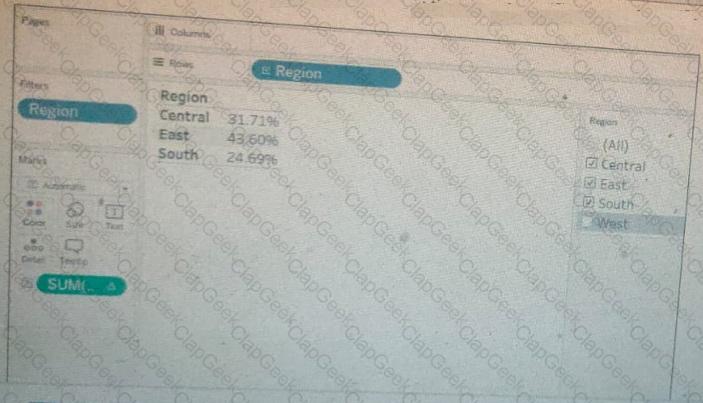
Which calculation should fix the automatic recalculation on the % of total field?
A transport and delivery company uses a command center dashboard in its logistics and distribution hubs. The dashboard is displayed on screens to show fleet movements, delivery status, and warehouse operations. The company needs the dashboard to provide up-to-date information without human intervention. The company's environment cannot access the internet, and the data source is configured to maintain a real-time connection.
How should the company meet this requirement?
A client wants to flag orders that have sales higher than the regional average.
Which calculated field will produce the required result?
A company has a sales team that is segmented by territory. The team's manager wants to make sure each sales representative can see only data relevant to
that representative's territory in the team Sales Dashboard.
The team is large and has high turnover, and the manager wants the mechanism for restricting data access to be as automated as possible. However, the
team does not have a Tableau Data Management license.
What should the consultant recommend to meet the company's requirements?
A Tableau consultant is asked to evaluate a workbook that is slow to respond and make a recommendation on possible performance improvements. The workbook connects to three extract data sources from an SQL database. The sheets are used in five dashboards. The consultant runs a performance recording on the workbook and notices that the largest amount of time is spent on rendering the visualizations.
What is the most effective approach to reduce the workbook's rendering time?
A consultant is working with a Tableau Server customer. The customer asks the consultant if there is a need to upgrade their instance of Tableau Server that was installed over 1 year ago.
Which two situations justify the need for an upgrade? Choose two.
A Tableau Cloud client has requested a custom dashboard to help track which data sources are used most frequently in dashboards across their site.
Which two actions should the client use to access the necessary metadata? Choose two.
A client is considering migrating from Tableau Server to Tableau Cloud.
Which two elements are determining factors of whether the client should use Tableau Server or Tableau Cloud? Choose two.
A consultant wants to improve the performance of reports by moving calculations to the data layer and materializing them in the extract.
Which type of calculation is the consultant able to move?
A new Tableau user created a simple dashboard on Tableau Server using supply chain data. Now, the user wants to know if they created the dashboard in
accordance with specific performance best practices.
Which approach should the consultant recommend for the client to make this determination?
A client is using the Tableau Content Migration Tool to move content from an old Tableau Server to a new Tableau Server.
Which content will need to be moved using a different tool or process?
Use the following login credentials to sign in
to the virtual machine:
Username: Admin
Password:
The following information is for technical
support purposes only:
Lab Instance: 40201223
To access Tableau Help, you can open the
Help.pdf file on the desktop.
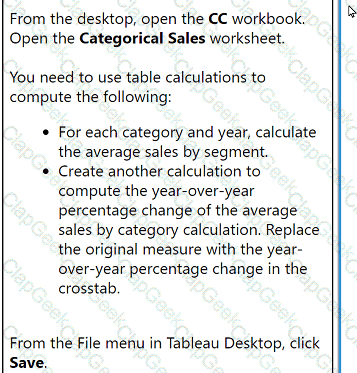
From the desktop, open the CC workbook.
Open the Categorical Sales worksheet.
You need to use table calculations to
compute the following:
. For each category and year, calculate
the average sales by segment.
. Create another calculation to
compute the year-over-year
percentage change of the average
sales by category calculation. Replace
the original measure with the year-
over-year percentage change in the
crosstab.
From the File menu in Tableau Desktop, click
Save.
From the desktop, open the CC workbook. Use the US Population Estimates data source.
You need to shape the data in US Population Estimates by using Tableau Desktop. The data must be formatted as shown in the following table.
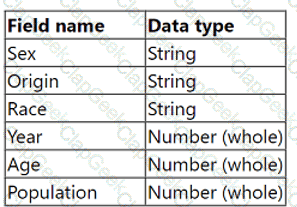
Open the Population worksheet. Enter the total number of records contained in the data set into the Total Records parameter.
From the File menu in Tableau Desktop, click Save.
From the desktop, open the CC workbook.
Open the Manufacturers worksheet.
The Manufacturers worksheet is used to
analyze the quantity of items contributed by
each manufacturer.
You need to modify the Percent
Contribution calculated field to use a Level
of Detail (LOD) expression that calculates
the percentage contribution of each
manufacturer to the total quantity.
Enter the percentage for Newell to the
nearest hundredth of a percent into the
Newell % Contribution parameter.
From the File menu in Tableau Desktop, click
Save.
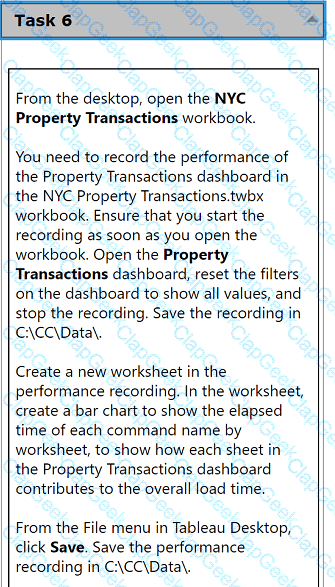
From the desktop, open the NYC
Property Transactions workbook.
You need to record the performance of
the Property Transactions dashboard in
the NYC Property Transactions.twbx
workbook. Ensure that you start the
recording as soon as you open the
workbook. Open the Property
Transactions dashboard, reset the filters
on the dashboard to show all values, and
stop the recording. Save the recording in
C:\CC\Data\.
Create a new worksheet in the
performance recording. In the worksheet,
create a bar chart to show the elapsed
time of each command name by
worksheet, to show how each sheet in
the Property Transactions dashboard
contributes to the overall load time.
From the File menu in Tableau Desktop,
click Save. Save the performance
recording in C:\CC\Data\.
From the desktop, open the CC workbook.
Open the Incremental worksheet.
You need to add a line to the chart that
shows the cumulative percentage of sales
contributed by each product to the
incremental sales.
From the File menu in Tableau Desktop, click
Save.
From the desktop, open the CC workbook.
Open the City Pareto worksheet.
You need to complete the Pareto chart to show the percentage of sales compared to the percentage of cities. The chart must show references lines to visualize how the data compares to the Pareto principle.
From the File menu in Tableau Desktop, click Save.


TESTED 06 Jul 2026