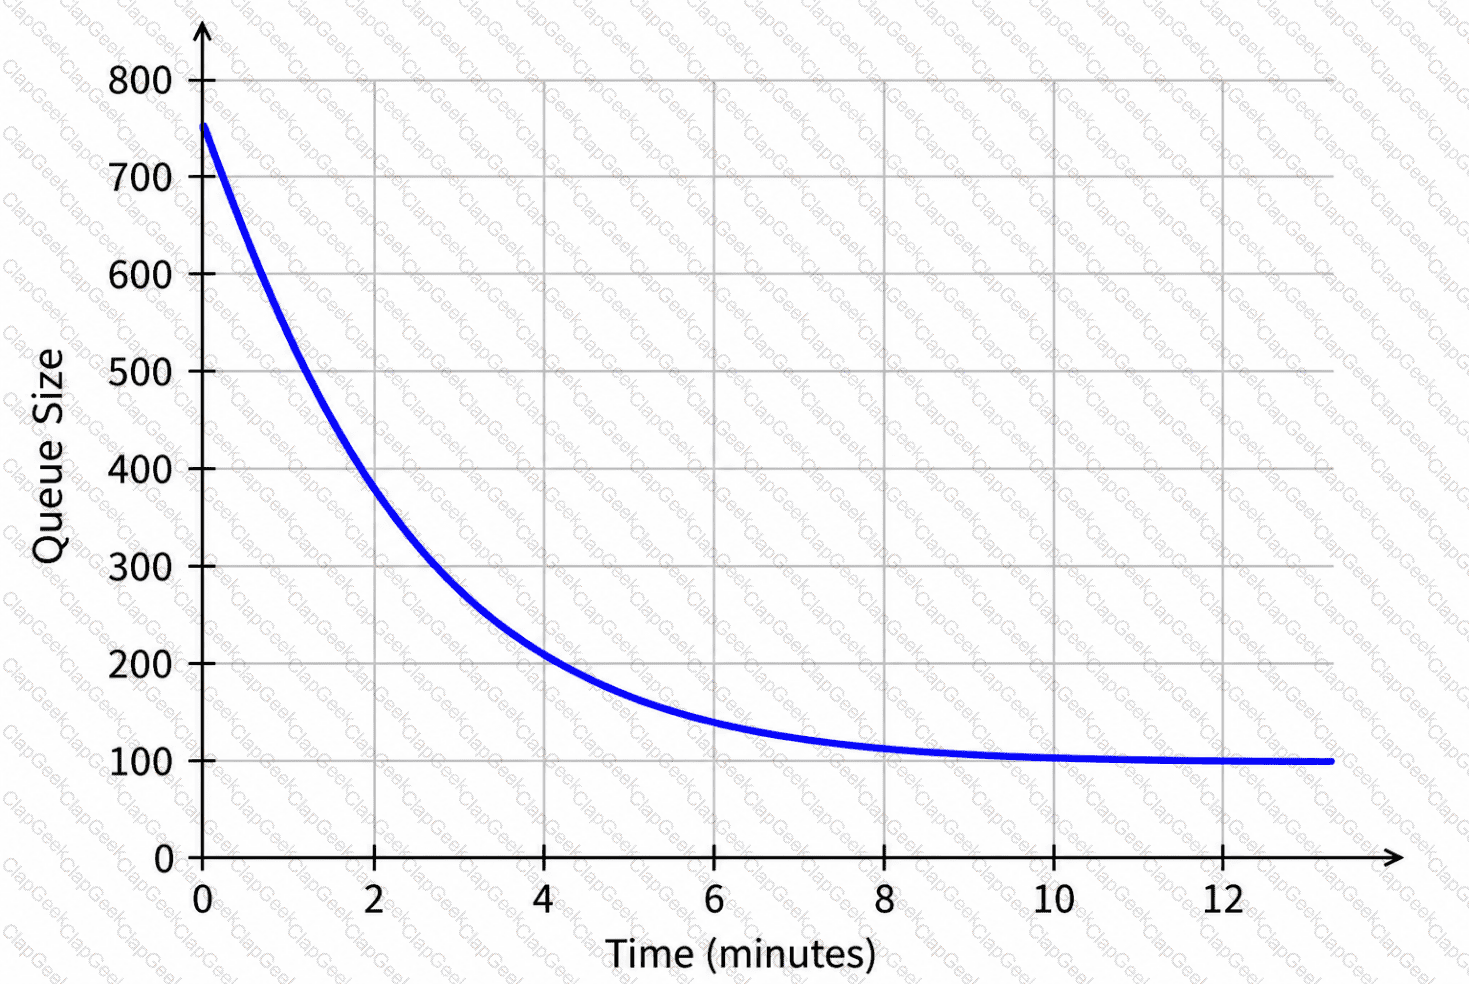
The graph shows the number of people waiting in a virtual queue to buy tickets for an event.
What does the horizontal asymptote mean?
The weekly number of players, P, in hundreds, on a gaming website is modeled by the graph. The horizontal axis shows the number of years since the website was launched.
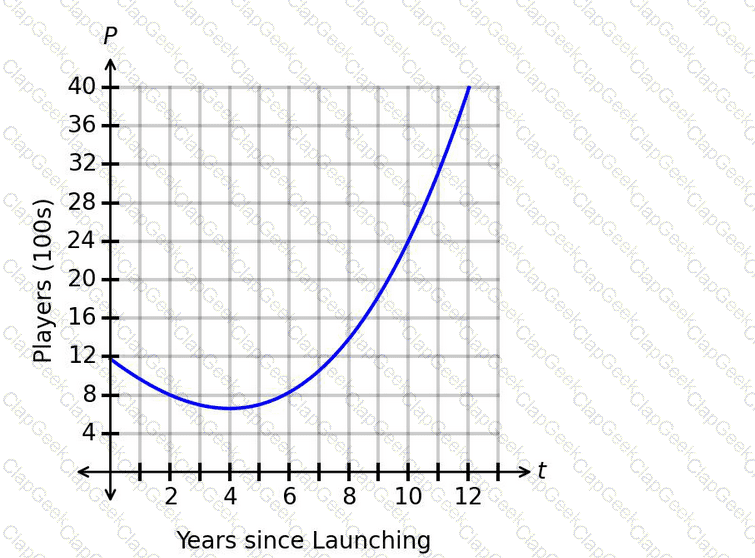
When did the website reach the minimum weekly number of players?
The graph shows the number of customers visiting a bookstore, where the number of days since the beginning of the month is along the horizontal axis and the number of customers visiting the bookstore each day is along the vertical axis. More customers show up to the store on days when new releases are featured than on other days.
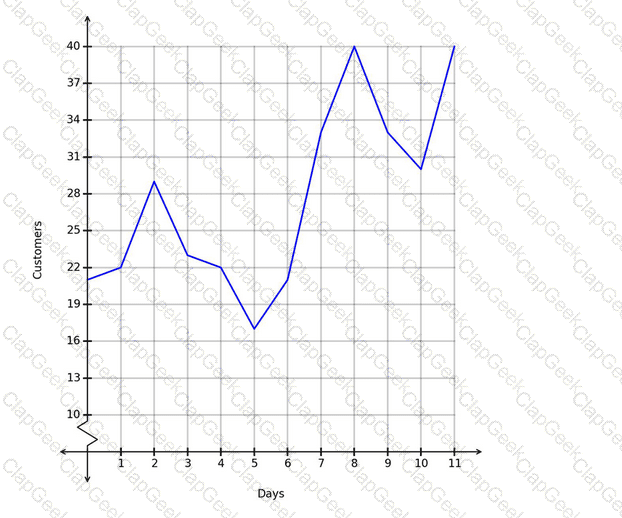
Which days likely featured new releases?
A team was assembled at a manufacturing plant in order to boost productivity. The team was tasked with producing as many widgets each day as possible. The results are shown in the graph.
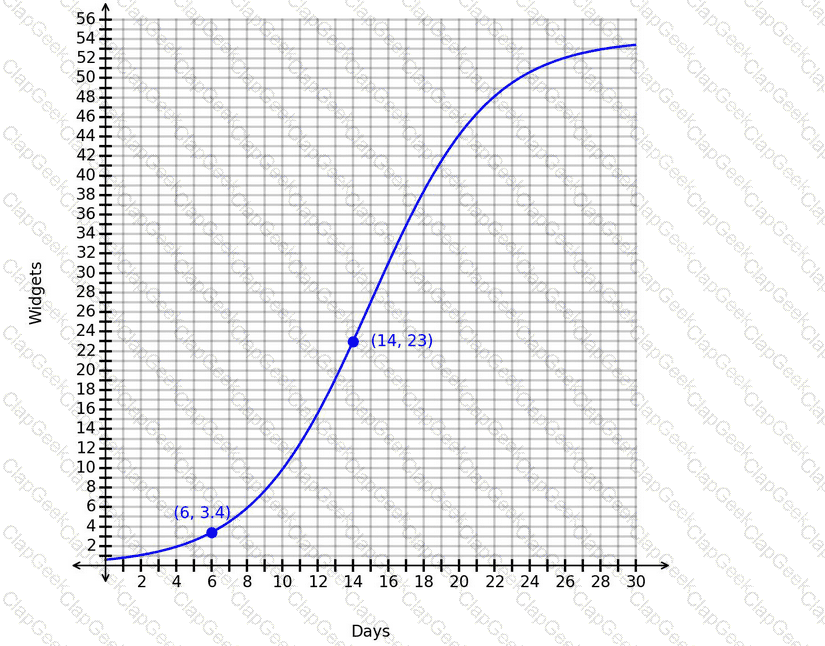
What is the correct interpretation of the average rate of change from day 6 to day 14?
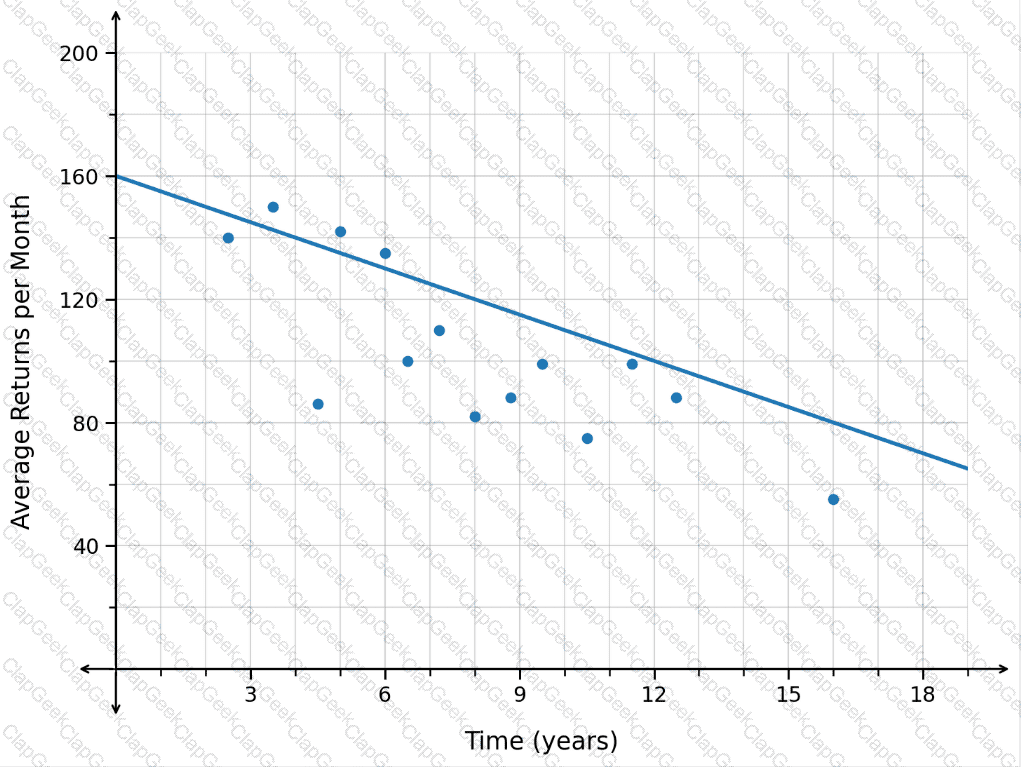
The data in the scatterplot represents the number of monthly train crossings at a particular intersection over time.
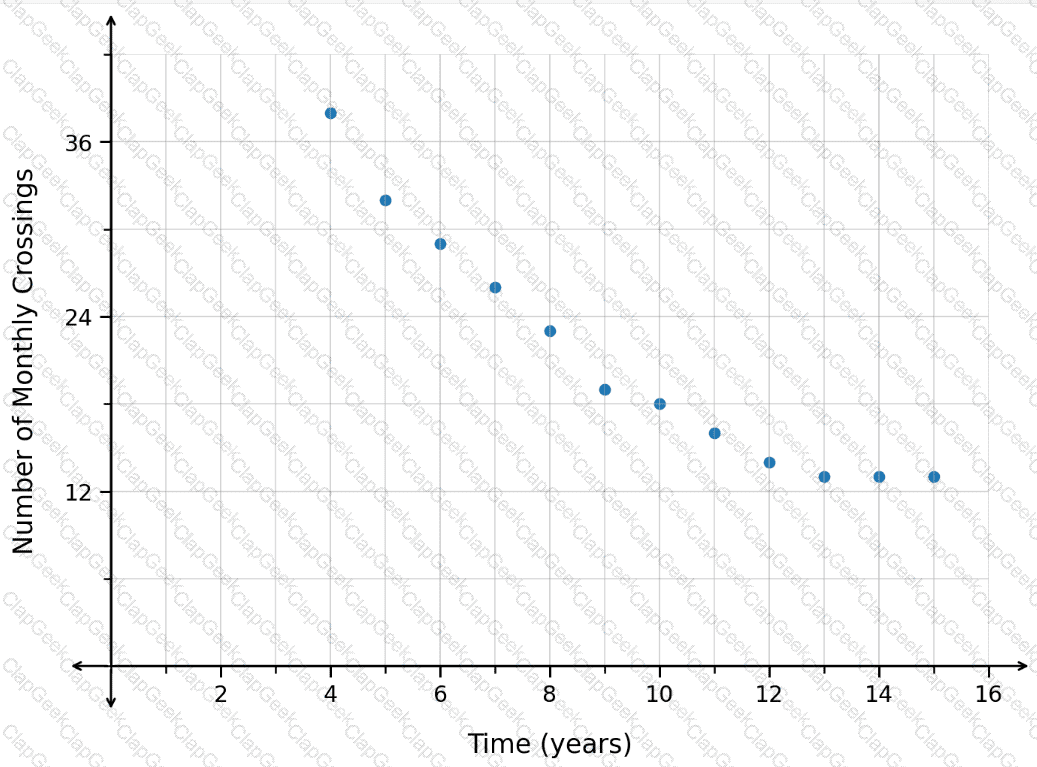
Which type of function should be used to model the data?
The population of fish in a lake is changing according to the function P(t)=31t+438, where t is the number of months since the beginning of the year and P(t) is the fish population at time t. Which interpretation of the rate of change is correct?
A researcher collected data on the number of annual bear sightings in a region over time. The results are shown in the scatterplot. A regression function is graphed with r^2=0.42. The predicted number of annual bear sightings after 19.5years is 62.2.
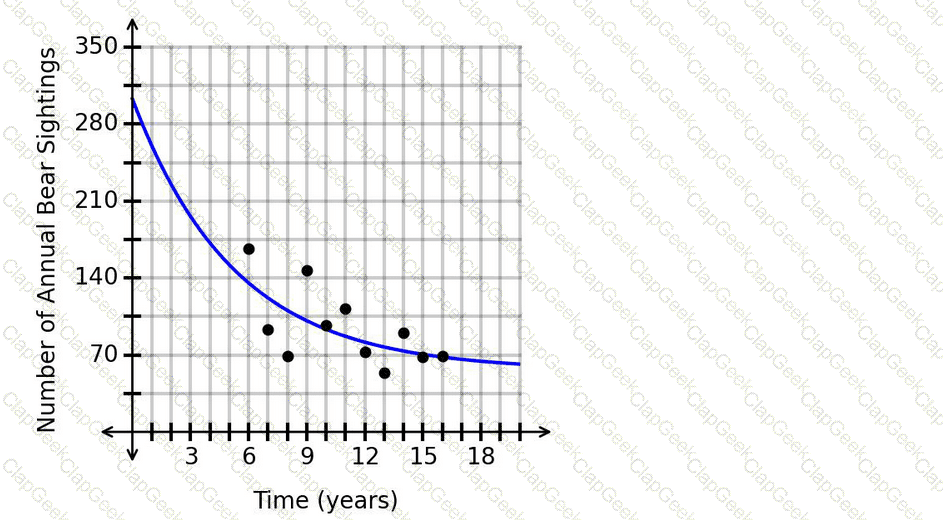
Is this prediction appropriate?
As regulations change, the number of licensed sellers of a product decreases. The graph models the change in the number of licensed sellers over time.
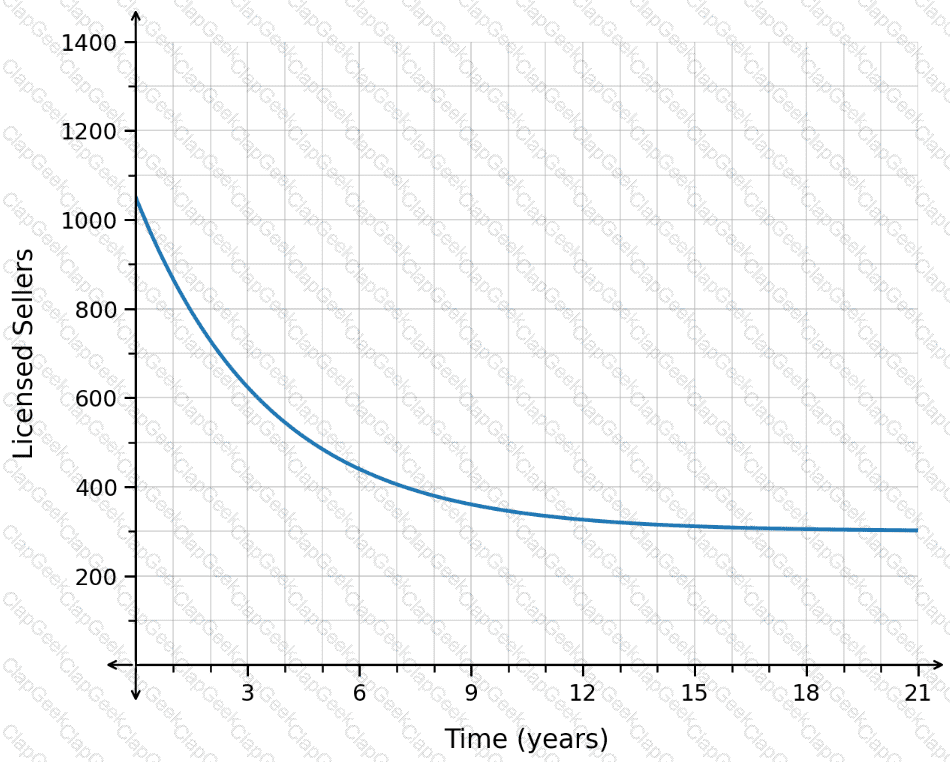
What does the horizontal asymptote mean?
A researcher collected data on the average selling price for tickets to a concert over time. The results are shown in the scatterplot. A regression function is graphed with r
2
=0.56. The predicted average selling price for tickets after 10.8 days is $167.20.
Is this prediction appropriate?
The function p(t)represents the number of active players, p, in a game thours after 11:00 a.m. The graph of p(t)is shown.
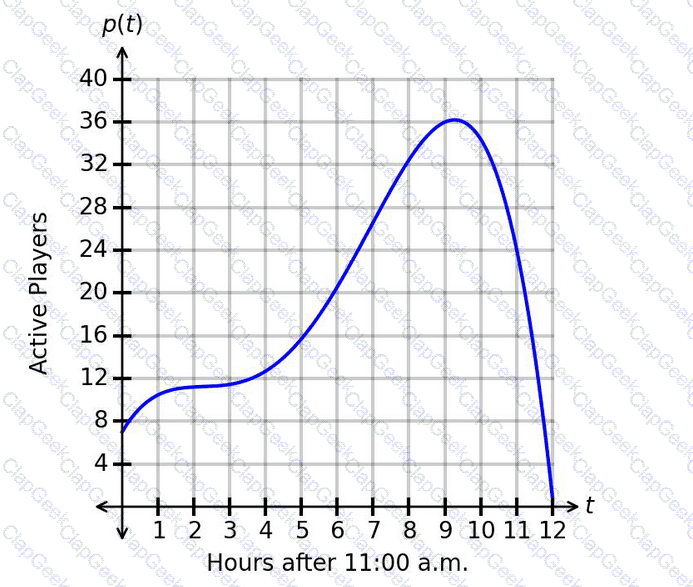
What is one example of an interval for which the number of players is decreasing faster and faster?
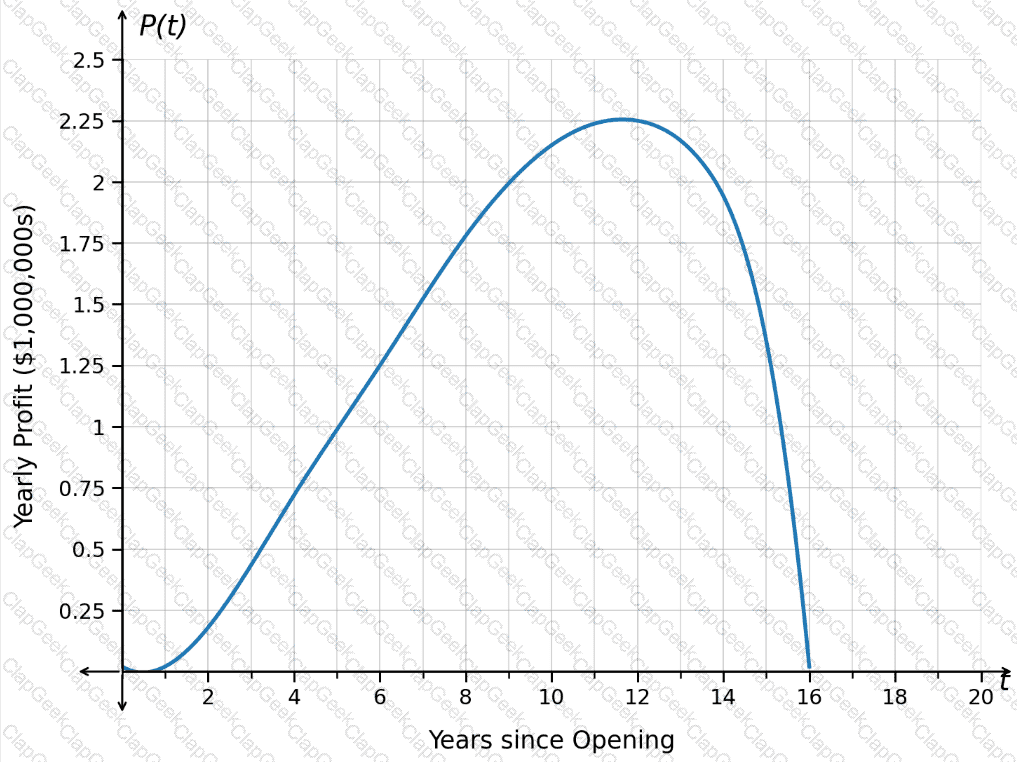
The function P(t)represents the yearly profit, in millions of dollars, for a streaming service since opening. The graph of P(t)is shown.
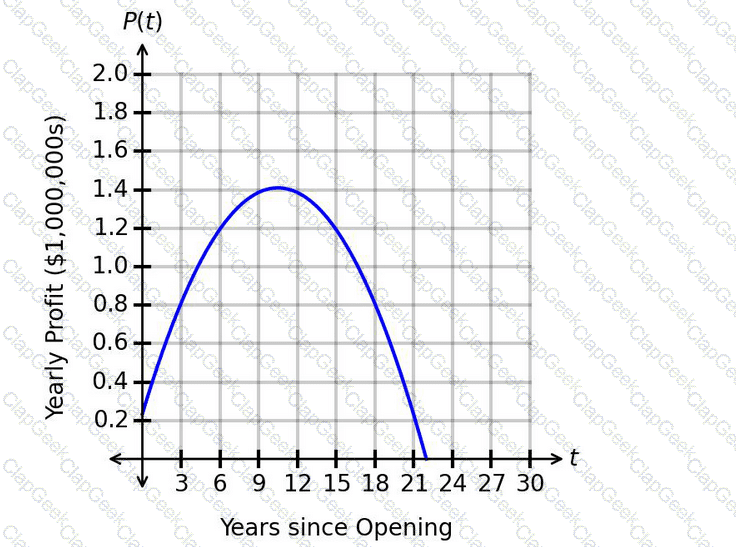
What is the correct interpretation of the maximum value?
A factory mixes two colors, red and yellow, to create a dye.
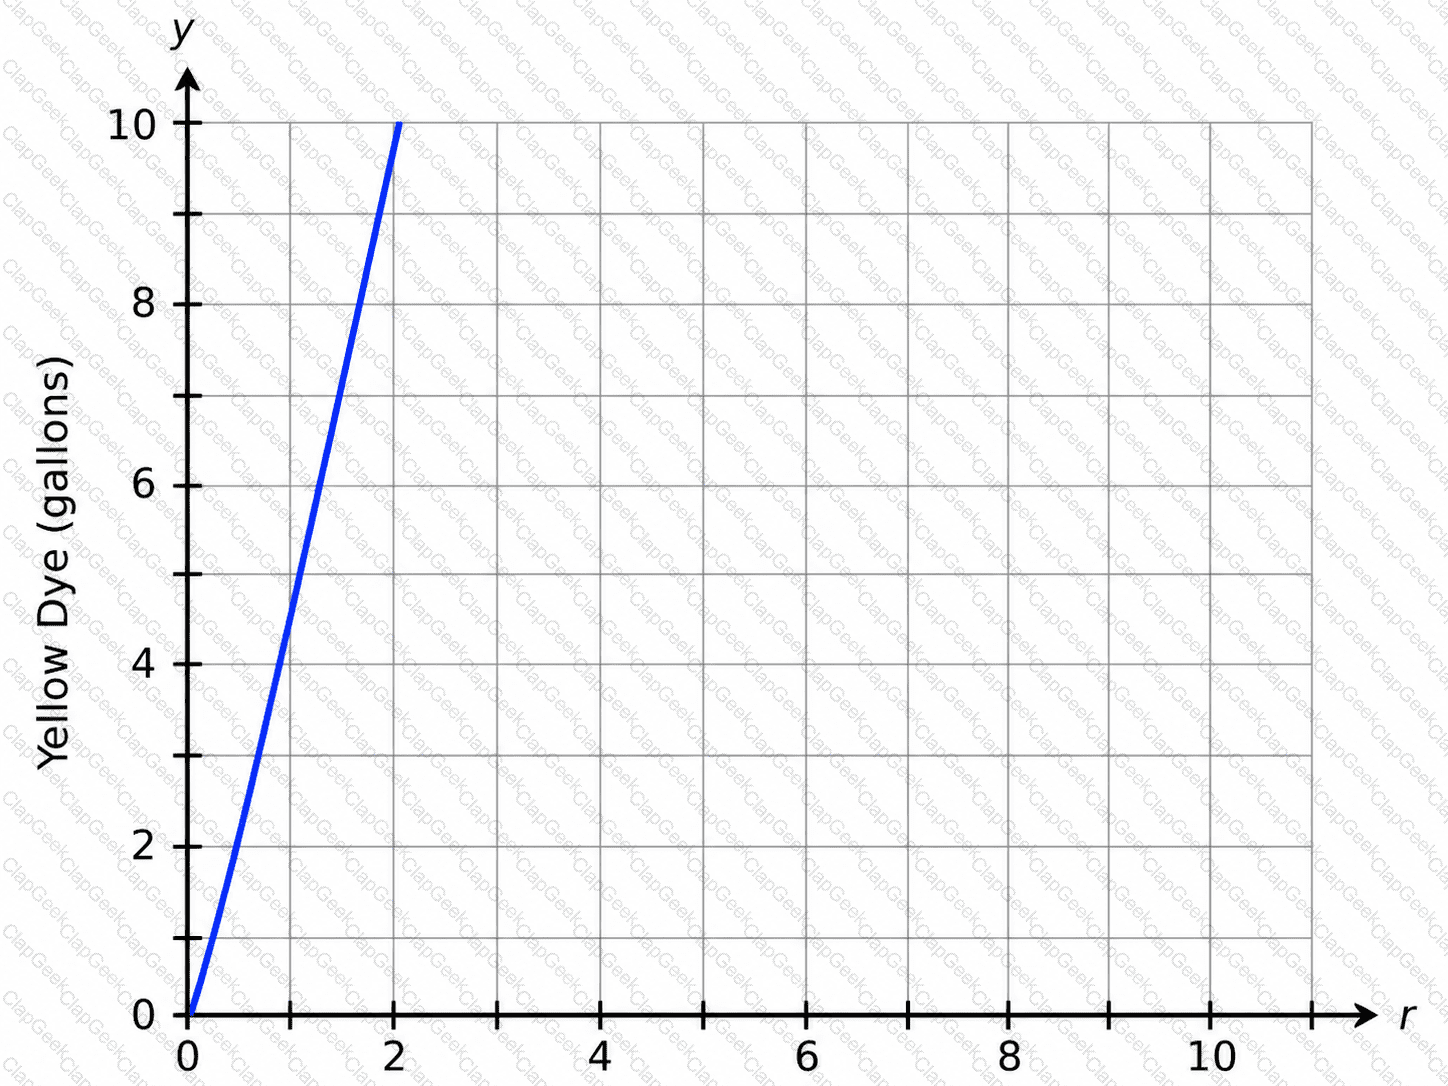
The graph shows the relationship between the amounts of each dye, where rrepresents the amount of red dye and yrepresents the amount of yellow dye.
What is the correct interpretation of the rate of change?
As sacks are unloaded off a wagon, the total weight of the wagon and sacks changes. Each sack has the same weight. After 5 sacks are removed, the total weight of the wagon and remaining sacks is 135 pounds. After 9 sacks are removed, the total weight is 87 pounds. What is the weight of each sack?
A researcher collected data on the average number of product returns per month to a company over time. The results are shown in the scatterplot. The graphed regression function has an r
2
value of 0.45.
Which range of x-values is appropriate for extrapolation?
The graph shows the progress of a manufacturing team, modeling the number of widgets the team is able to produce each day since the team was formed.
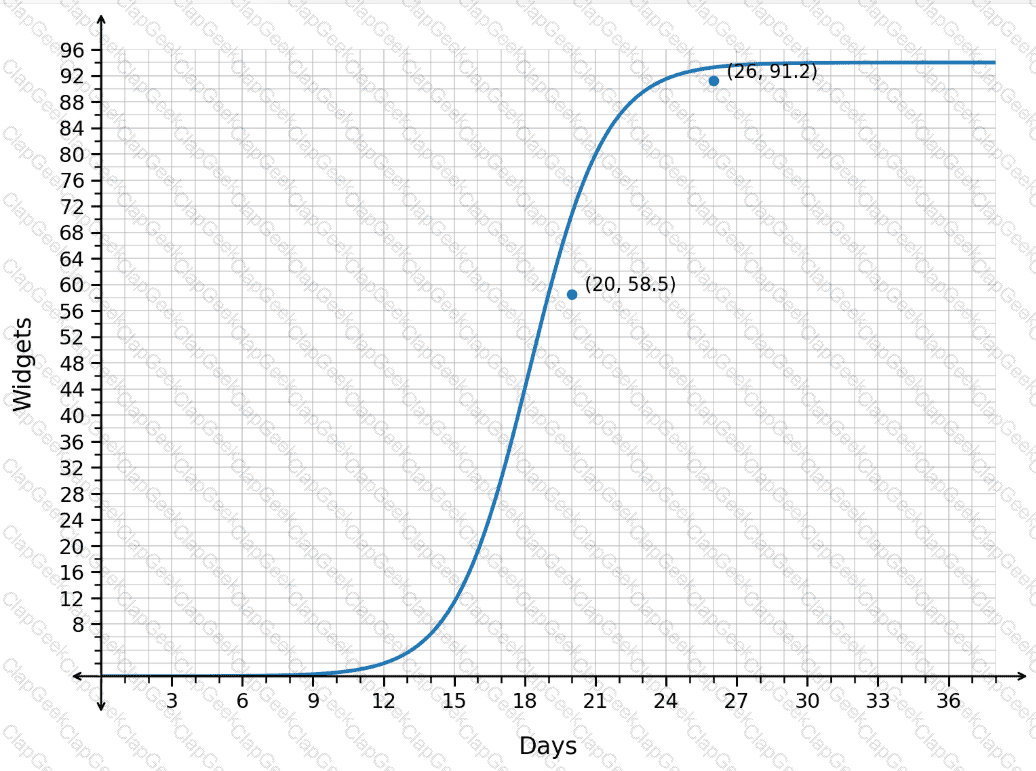
How should the average rate of change from day 20 to day 26 be interpreted?
The temperature of an object changes according to the relationship in the graph.
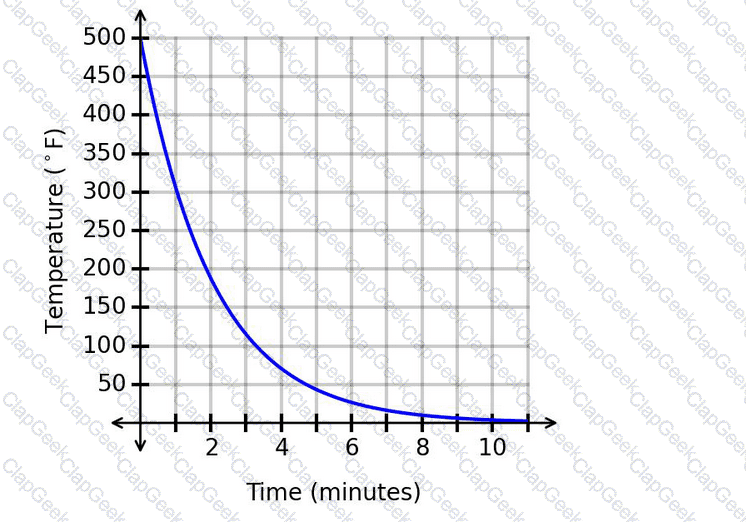
What is the equation of the horizontal asymptote?
The number of registered voters in a district is modeled by a decreasing exponential function, where x represents the number of years since 2005 and f(x) represents the number of registered voters.
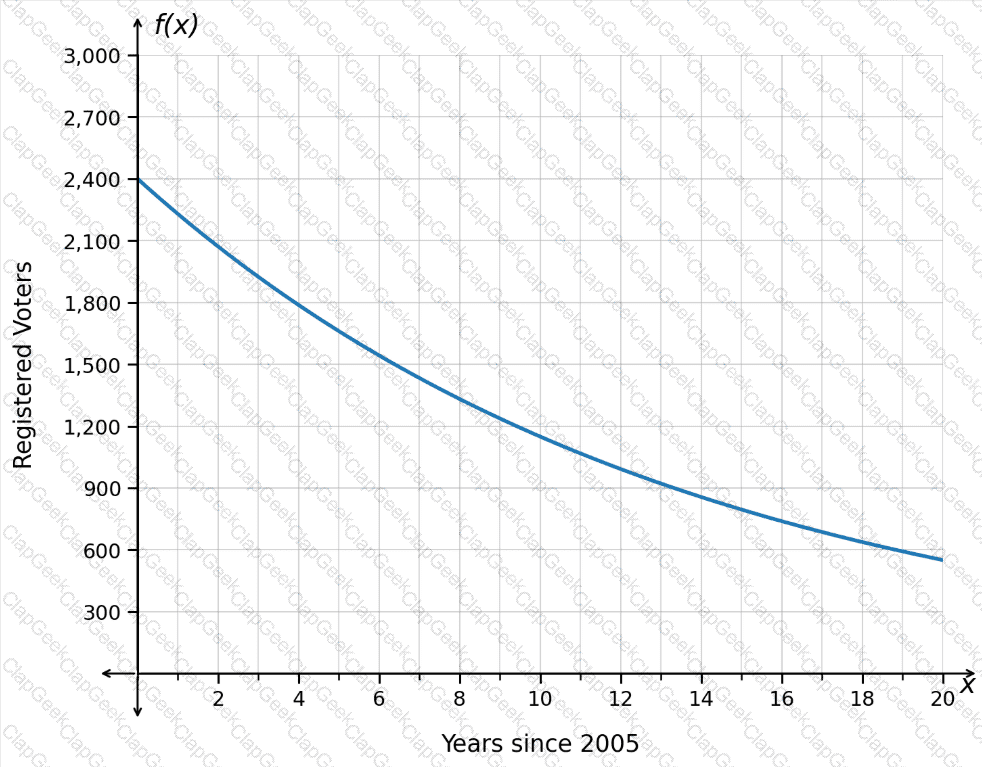
Which interval is associated with the slowest average decrease in the number of registered voters?
The number of people auditioning for a game show is expected to be 3 less than the number of people who auditioned last year. The function A(t)can be used to model the situation, where trepresents the number of people who auditioned last year and Arepresents the number of people expected to audition this year.
Which quantity represents the number of people expected to audition this year, given that 280 people auditioned last year?
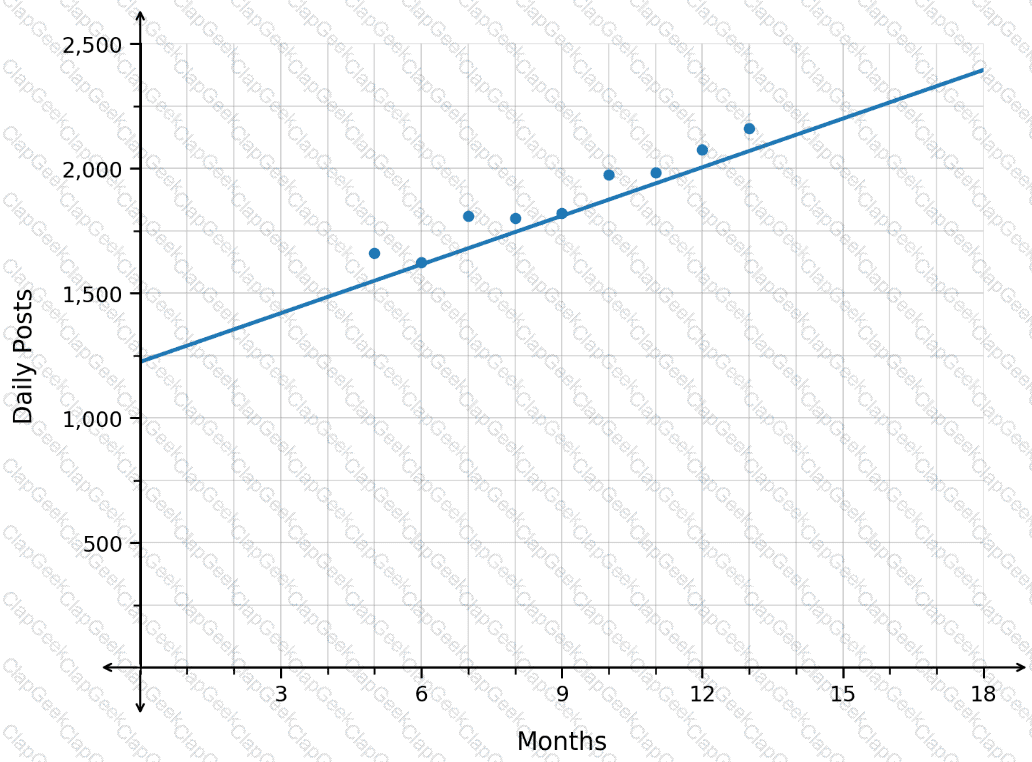
The number of comments on a social media post is represented by the logistic function f(x), whose graph is shown, where xrepresents the number of days since the post was created and f(x)represents the number of comments on day x.
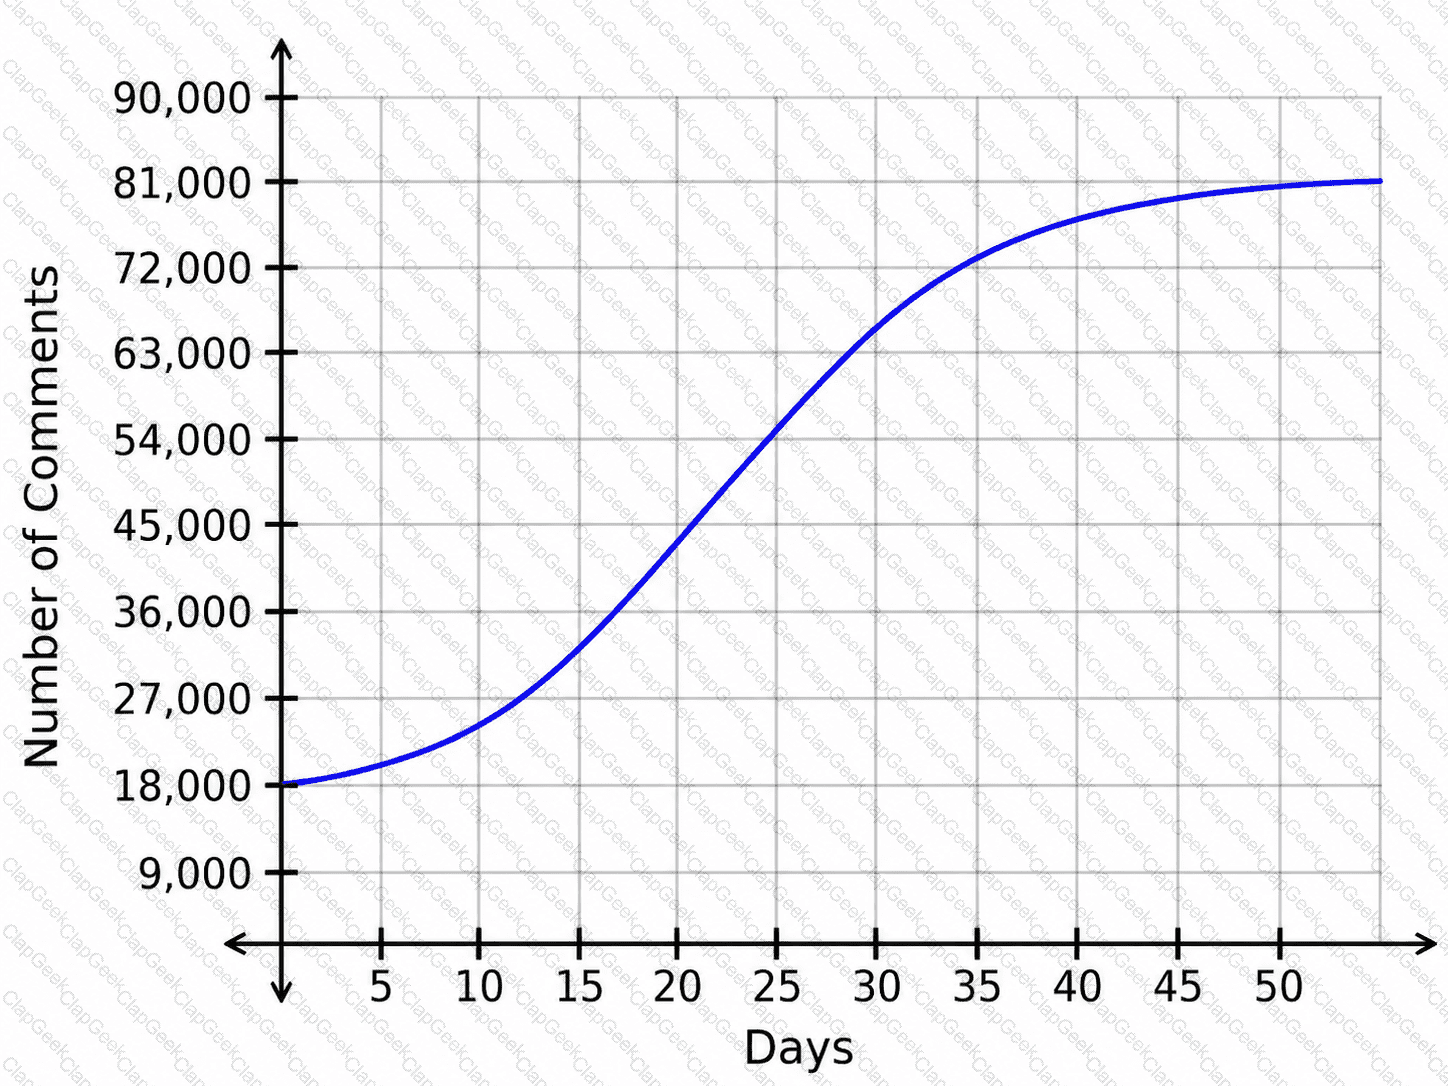
How does the number of comments change as time progresses from day 1 to day 17?
The function d(x)=14+65xrepresents the distance, in meters, from a tower to an object at time x, in seconds.
What is the value of d(1.5)?
In the graph showing the number of new customer accounts, the horizontal axis shows the number of weeks since the beginning of winter and the vertical axis shows the number of new customer accounts. More customer accounts are opened during snowy weeks than during weeks without snow.
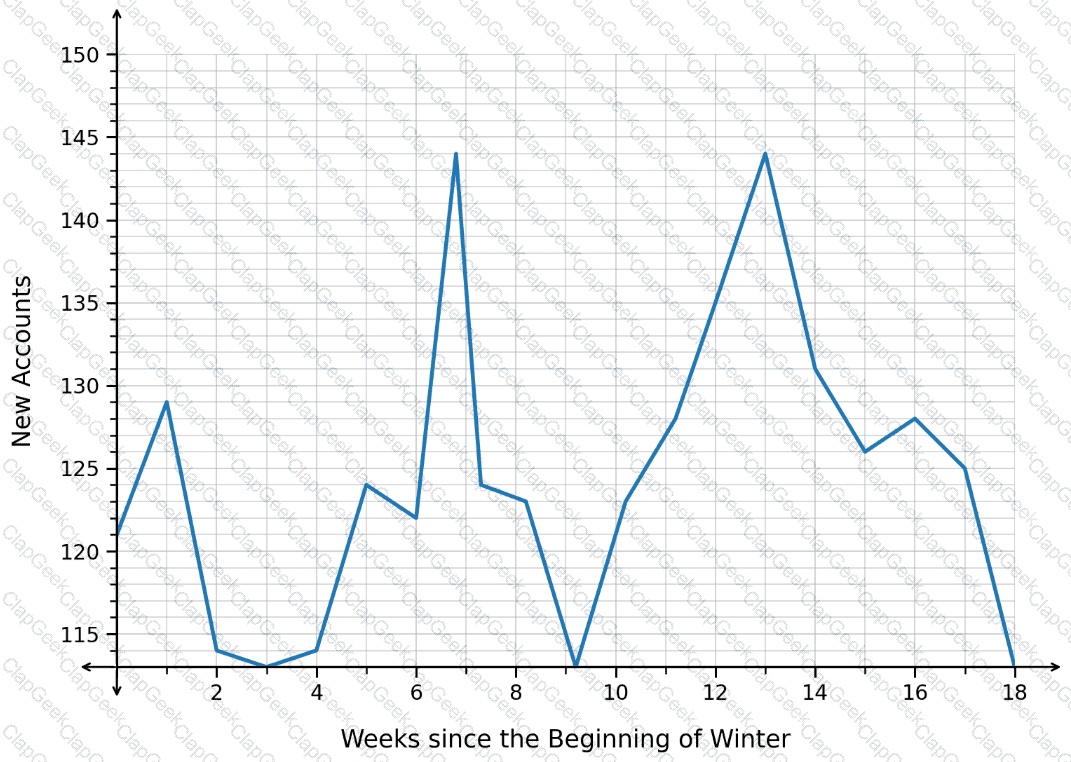
When was it likely snowy?
The number of wild horses in a federal park is represented by the logistic function f(x), whose graph is shown, where xrepresents the number of years since the park was established and f(x)represents the wild horse population in a given year.
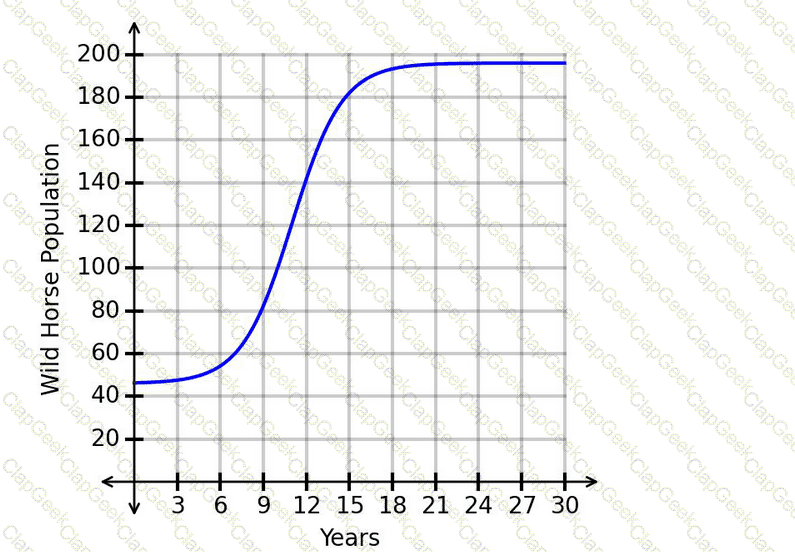
How does the number of wild horses change as time progresses from year 1 to year 9?
The values, in dollars, of two accounts over time are modeled by
A_1 (t)=6,500× 〖 1.05 〗 ^t
and
A_2 (t)=3,000× 〖 0.96 〗 ^t
The variable tis measured in years.
What is the difference between the accounts after 3 years?
Consider the function I(m)=41m²−490m+30, which represents the daily income, I, in dollars, of a store based on the number of months, m, since the beginning of the year. What is the difference between I(7) and I(9)?
The function P(t)represents the daily profit, in hundreds of dollars, for a museum since opening. The graph of P(t)is shown.
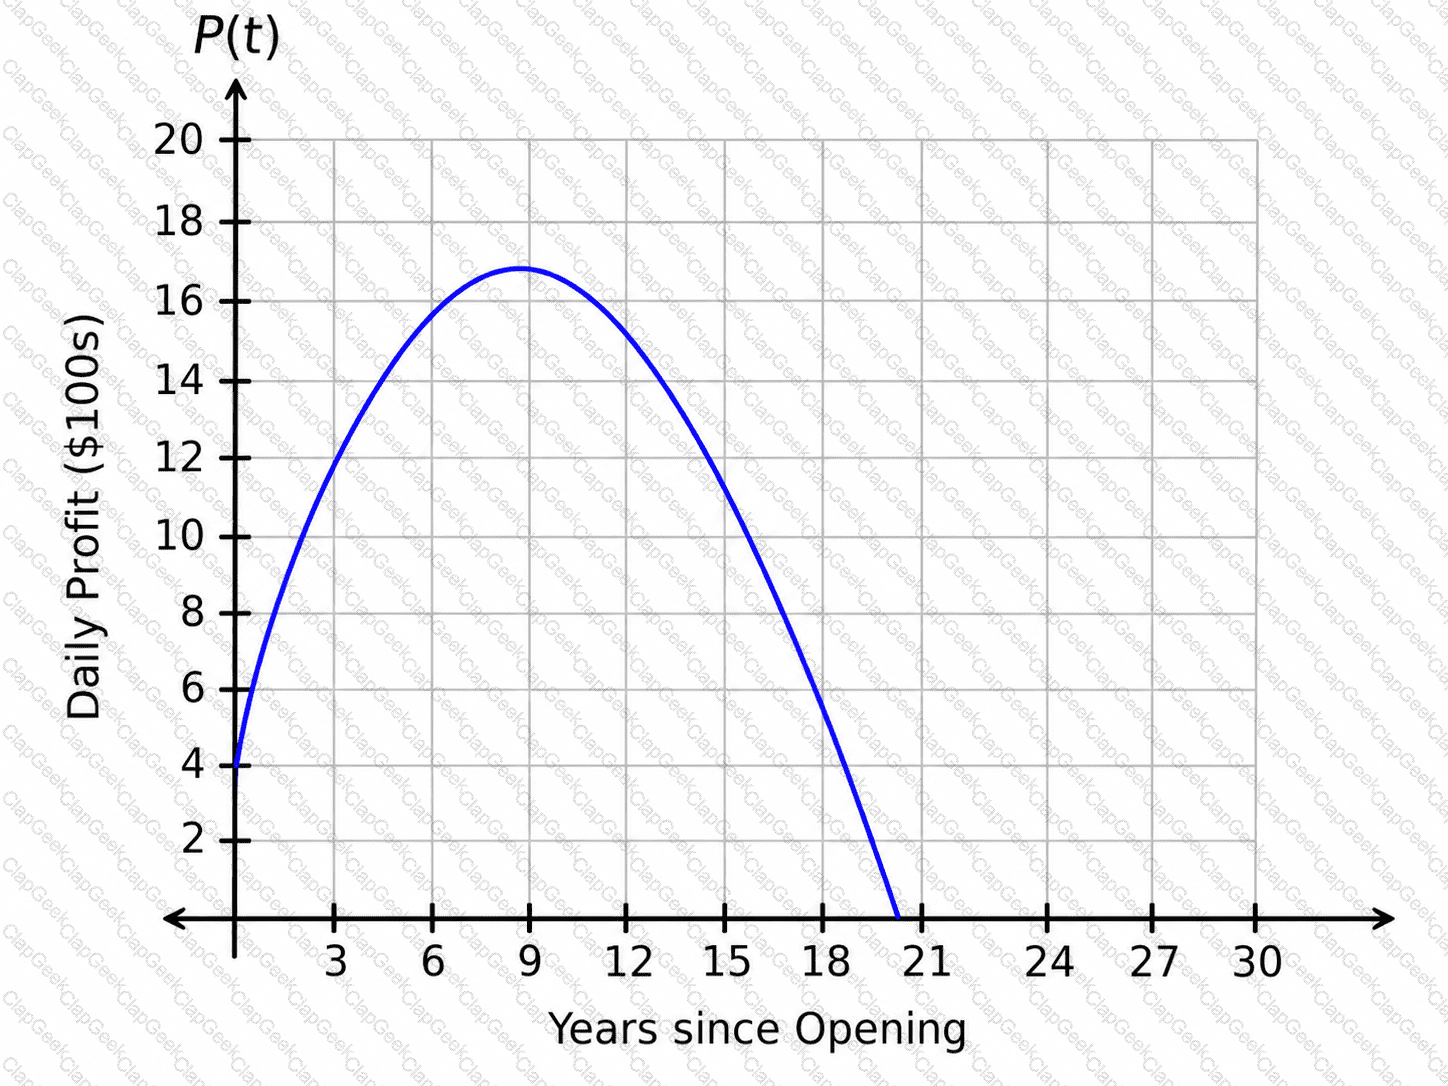
What is the correct interpretation of the maximum value?
The number of people auditioning for a game show is expected to be 7 more than the number of people who auditioned last year. The function A(t) can be used to model the situation, where t represents the number of people who auditioned last year and A(t) represents the number of people expected to audition this year. Which quantity represents the number of people expected to audition this year, given that 440 people auditioned last year?
The populations, in thousands, of two towns are shown in the graph, where the horizontal axis measures the time in years.
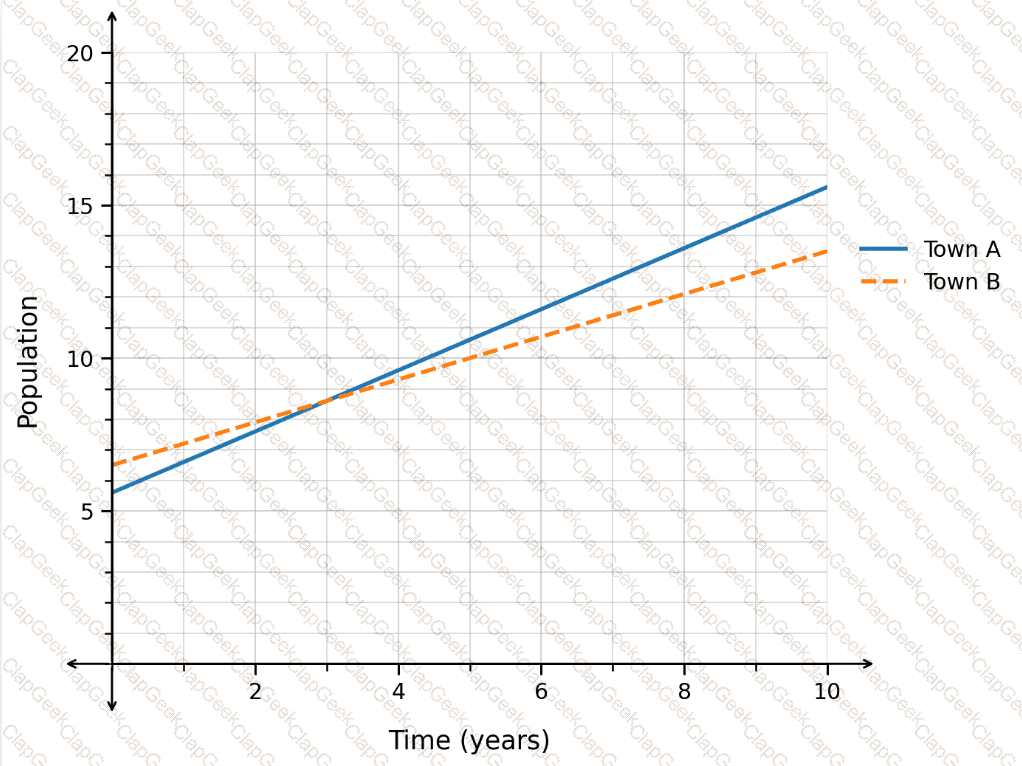
Which town’s population is growing at a faster rate?
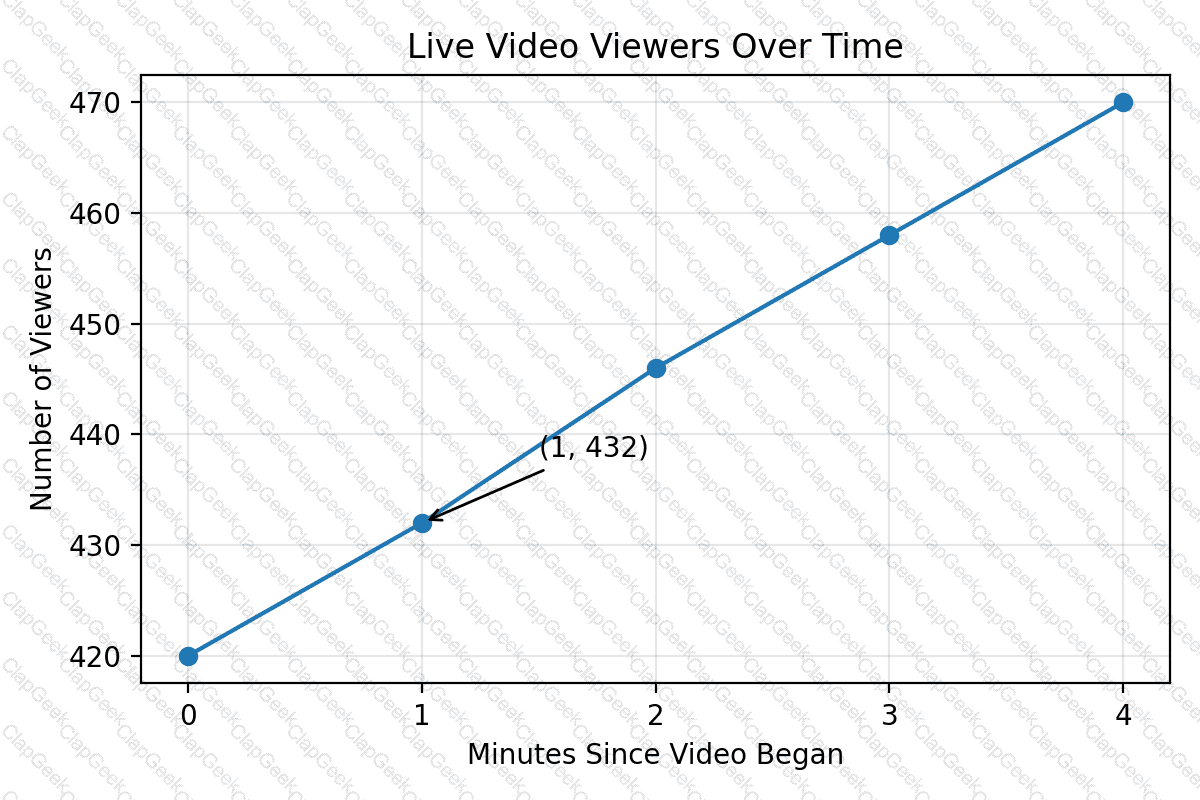
The graph shows the number of people watching a live video. The number of minutes since the video began is on the horizontal axis, and the number of viewers is on the vertical axis. When were there 432 viewers?
Exhibit:
The population of fish in a lake is changing according to the function
P(t)=24t+185
where tis the number of months since the beginning of the year and P(t)is the fish population at time t.
Which interpretation of the rate of change is correct?
The number of daily raffle tickets sold, R(d), for a fundraiser is represented by the graph, with the number of days since the beginning of the month along the horizontal axis and the number of raffle tickets sold for the day along the vertical axis.
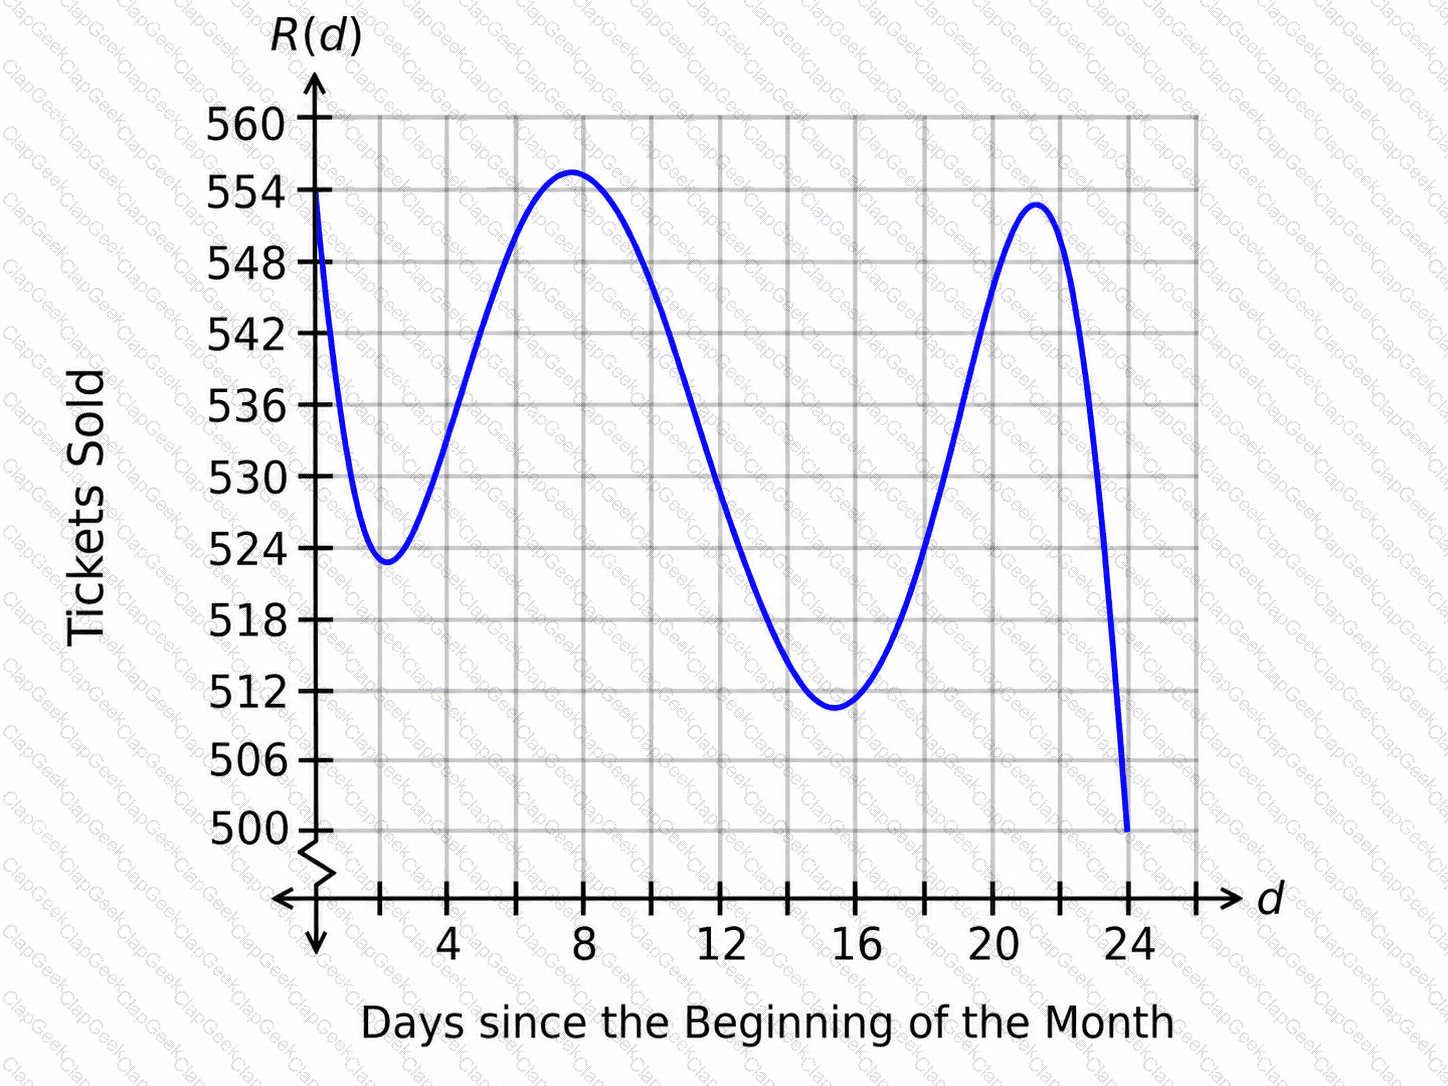
How can the concavity be described from d=0to d=4.4?
A person makes down quilts to sell.
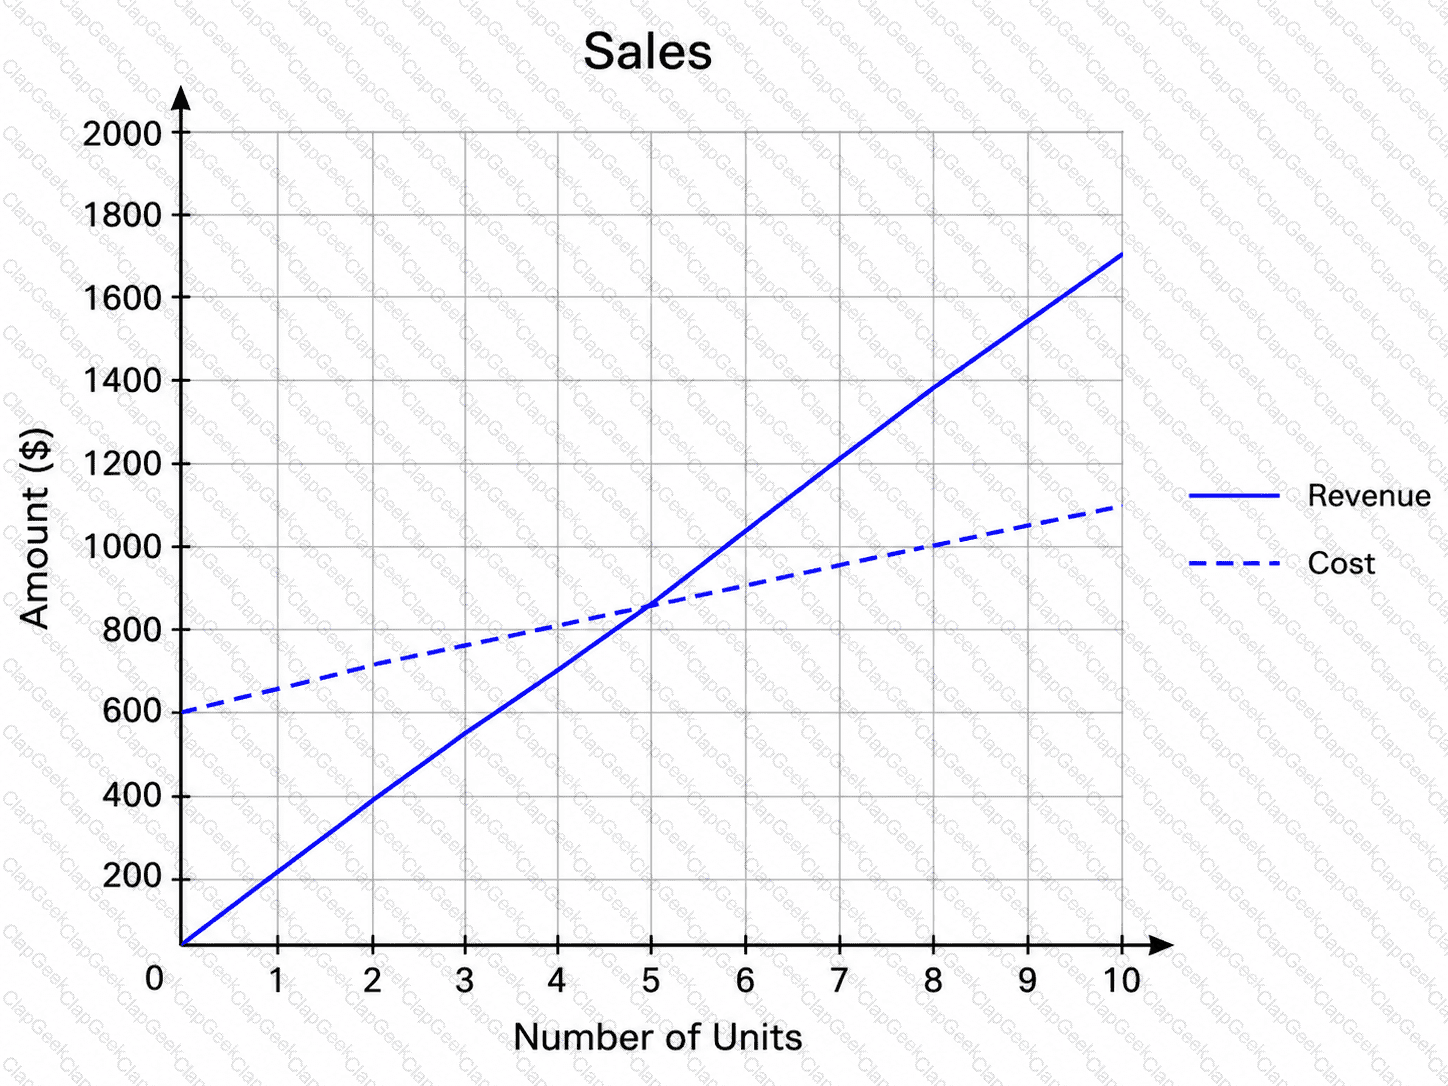
The graph shows the functions that model the cost and revenue.
How many down quilts need to sell to break even/start making a profit?
A researcher collected data on the number of books donated per month to a thrift store over time. The results are shown in the scatterplot. A regression function is graphed with r
2
=0.99.
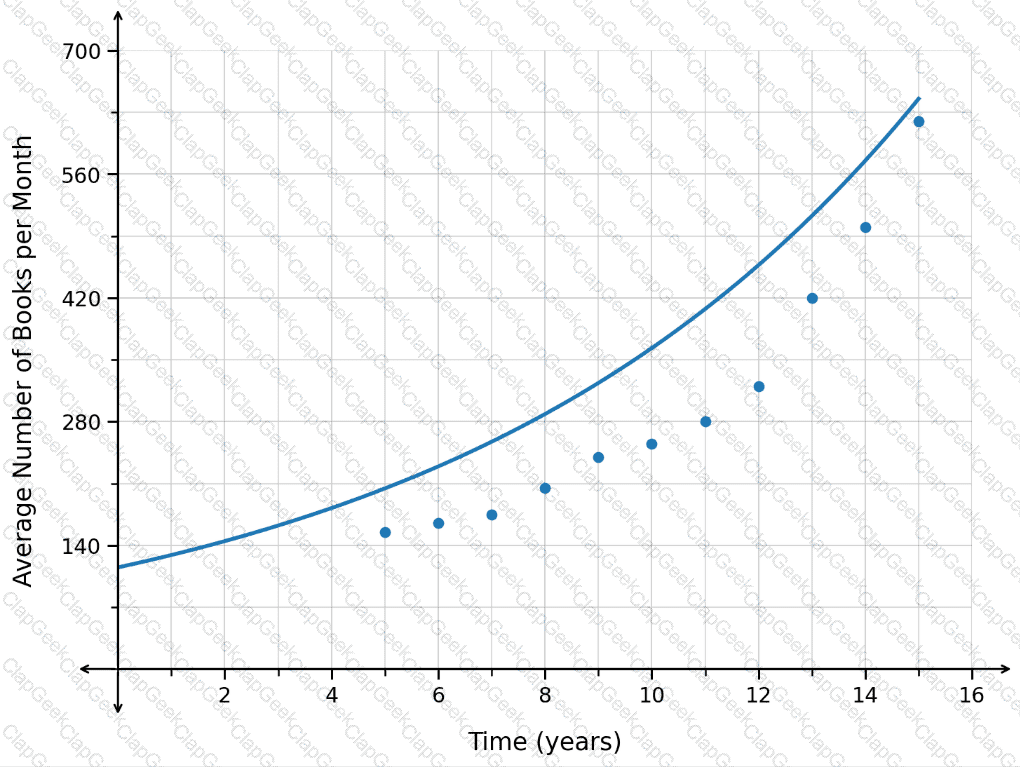
Which range of x-values is appropriate for extrapolation?
The spread of two viruses within a single population is modeled using the functions in the graph.
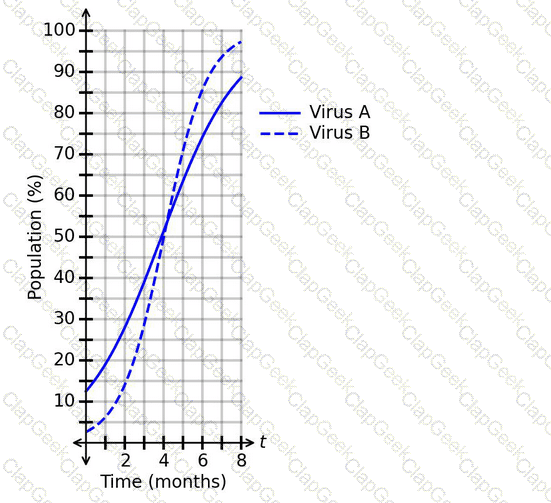
What is a correct conclusion based on the graph?
A vehicle is traveling away from a town at a fixed rate. After 1 hours, the vehicle is 200 miles from the town. After 4 hours, the vehicle is 395 miles from the town.
Which function represents the distance, d, between the vehicle and the town after thours?
Consider the graph of h(t) shown. The function represents the height, h, in feet, of a ball t seconds after being launched.
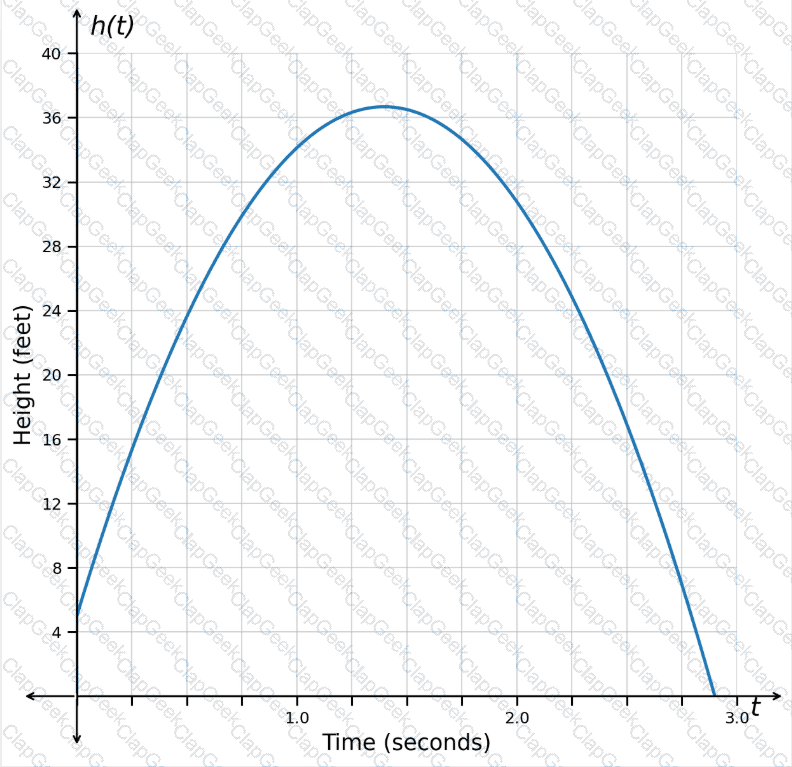
What is the point, if any, at which the concavity changes from concave down to concave up?
After a water tank starts leaking, the amount of water in the tank is modeled by the exponential function that is graphed.
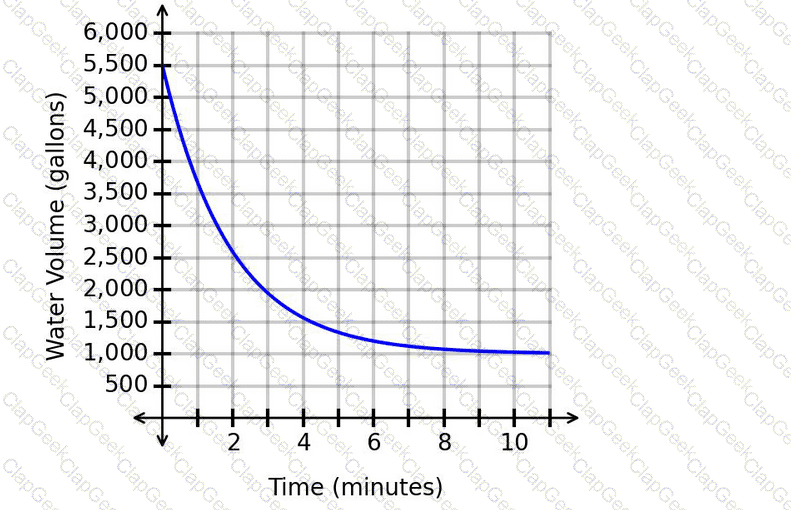
Which statement is justified considering the location of the horizontal asymptote?
The scatterplot shows data on the usage of a computer ' s CPU over time. The graphed regression function has an r^2value of 0.25.
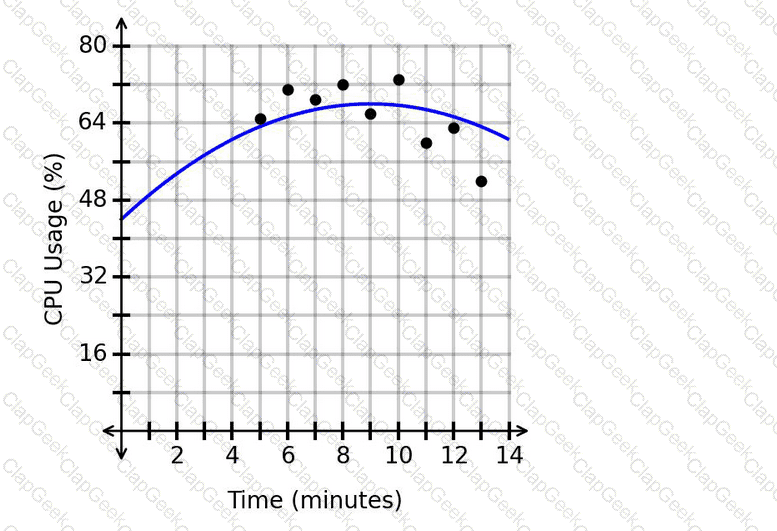
What is the appropriate range of x-values for extrapolation?
The graph shows the estimated wait time, in minutes, based on the number of hours after 7:00 a.m.
What is the average rate of change of the wait time from point Ato point B?
The function P(t) represents the yearly profit, in millions of dollars, for a clothing store since opening. The graph of P(t) is shown.
How should the maximum value be interpreted?


TESTED 08 Jul 2026