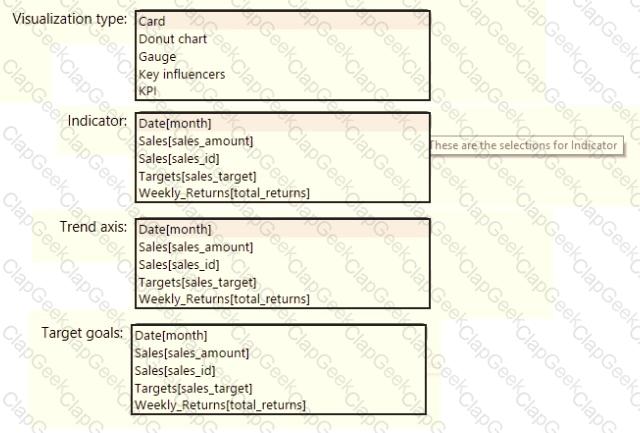
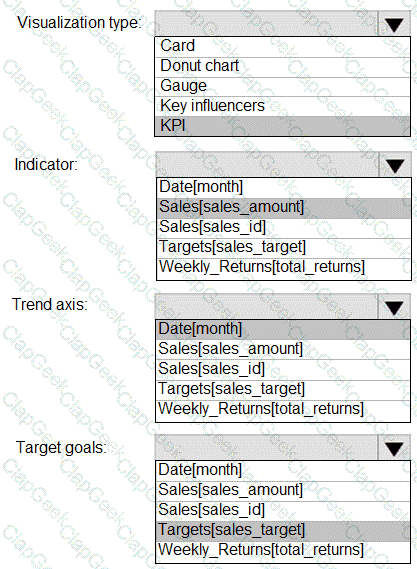
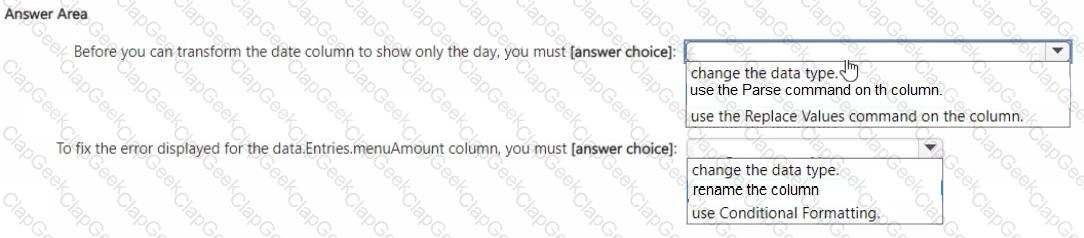
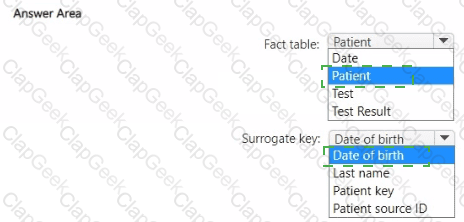
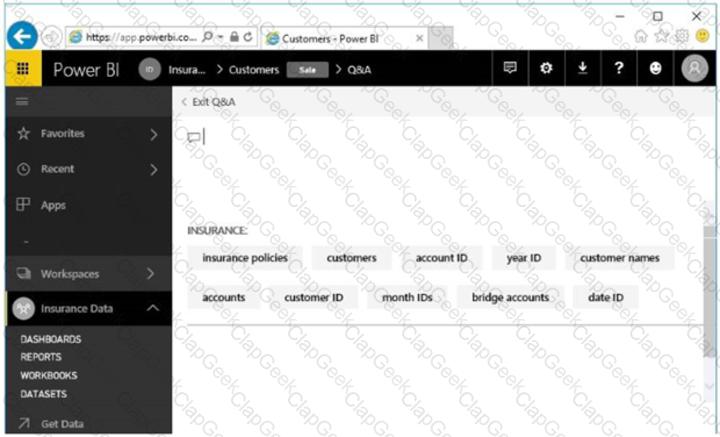
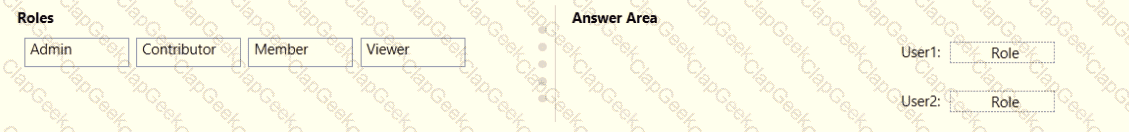
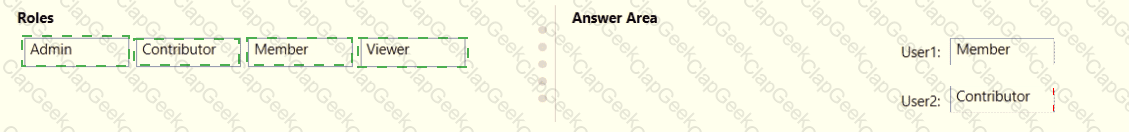
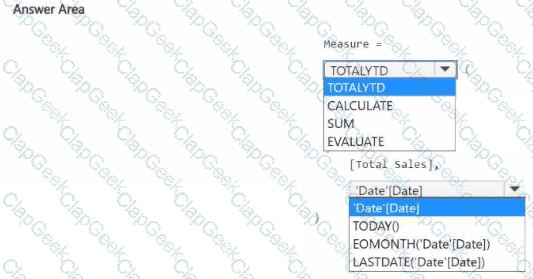
You need to create a DAX measure in the data model that only allows users to see projections at the appropriate levels of granularity.
How should you complete the measure? To answer, drag the appropriate values to the correct targets. Each value may be used once, more than once, or not at all. You may need to drag the split bar between panes or scroll to view content.
NOTE: Each correct selection is worth one point.
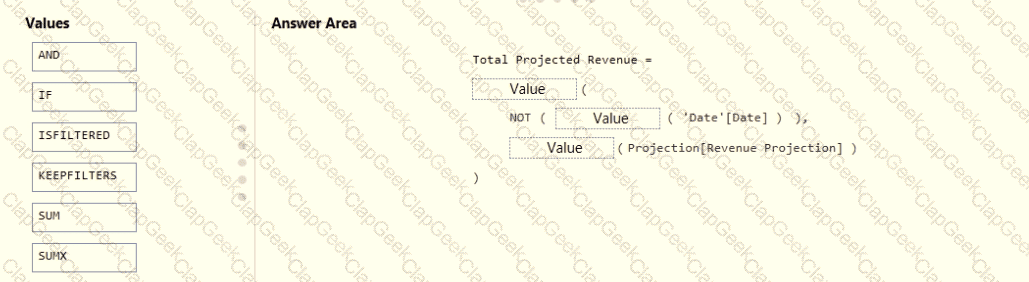
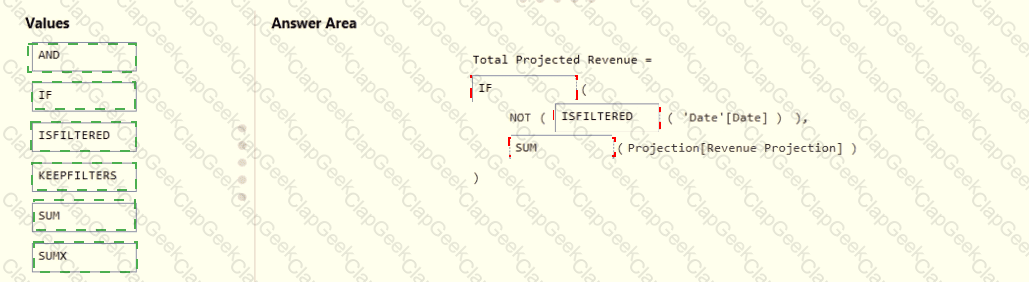
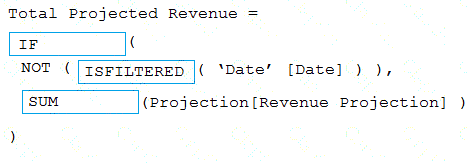
Scenario: Revenue projections are set at the monthly level and summed to show projections for the quarter.
Box 1: IF
Box 2: ISFILTERED
ISFILTERED returns TRUE when columnName is being filtered directly. If there is no filter on the column or if the filtering happens because a different column in the same table or in a related table is being filtered then the function returns FALSE.
Box 3: SUM
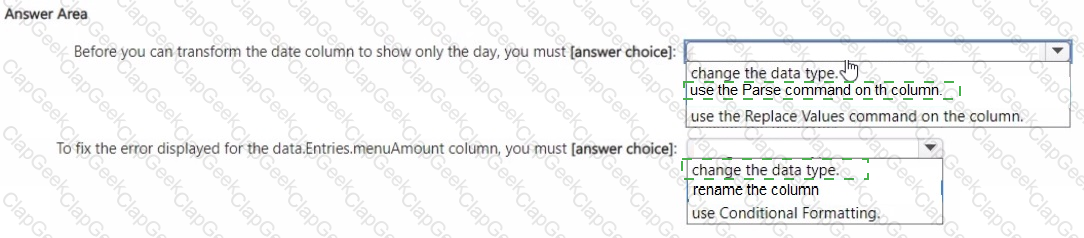
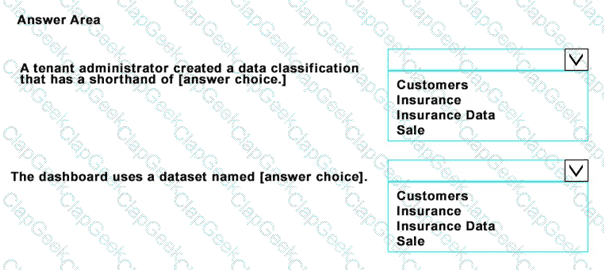
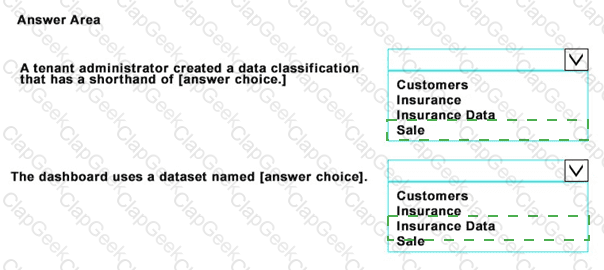
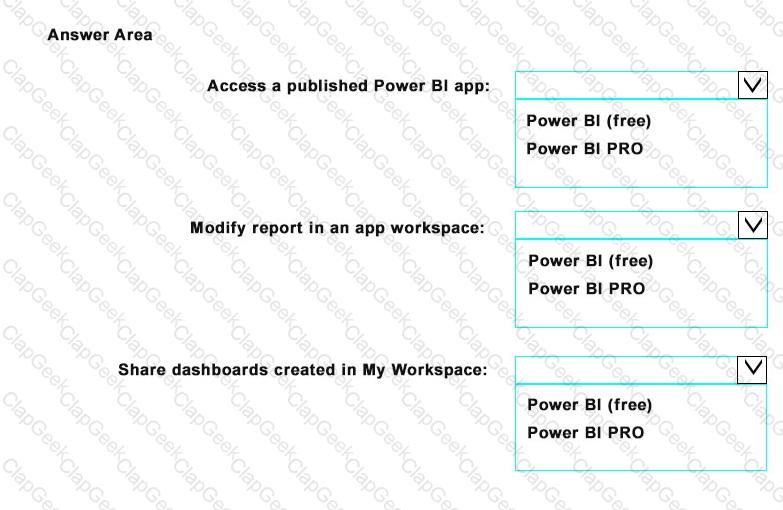
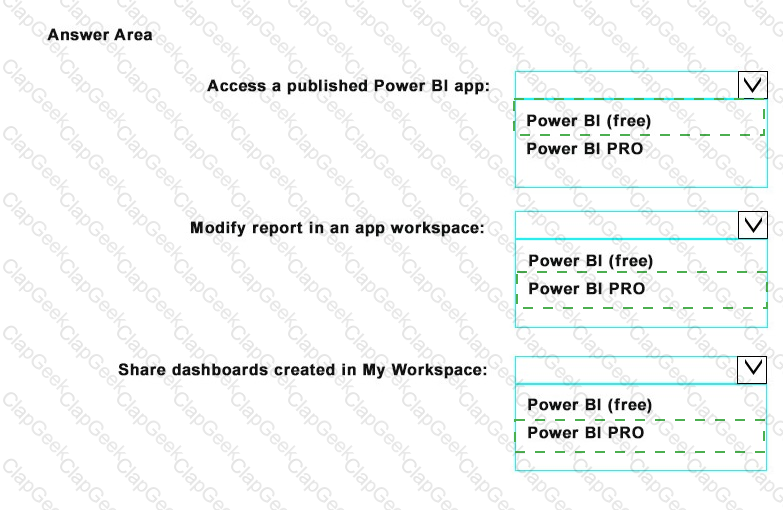
How should you distribute the reports to the board? To answer, select the appropriate options in the answer area.
NOTE: Each correct selection is worth one point.
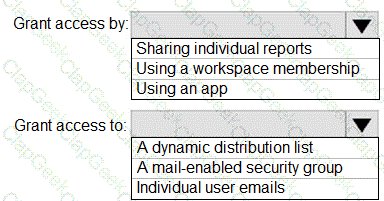
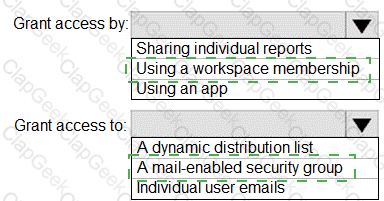
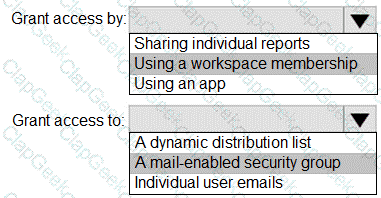
Box 1: Using a workspace membership
Scenario:
The company wants to provide a single package of reports to the board that contains custom navigation and links to supplementary information.
Note: Workspace is a shared environment for a group of people. You can have multiple Power BI content in a workspace. One workspace can have hundreds of dashboards, reports, and datasets in it.
Box 2: A mail-enabled security group
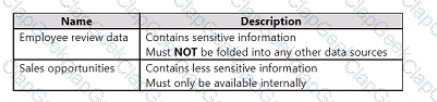
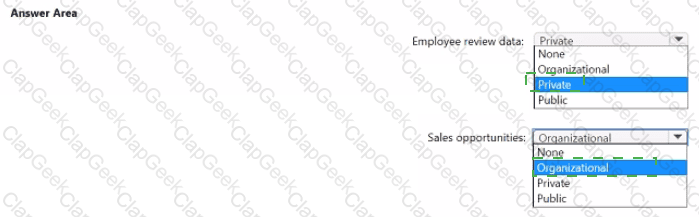
Scenario: Security Requirements
The reports must be made available to the board from powerbi.com. A mail-enabled security group will be used to share information with the board.
Which DAX expression should you use to get the ending balances in the balance sheet reports?
CALCULATE (SUM( BalanceSheet [BalanceAmount] ),DATESQTD( 'Date'[Date] ))
CALCULATE (SUM( BalanceSheet [BalanceAmount] ),LASTDATE( 'Date'[Date] ))
FIRSTNONBLANK ( 'Date' [Date]SUM( BalanceSheet[BalanceAmount] ))
CALCULATE (MAX( BalanceSheet[BalanceAmount] ),LASTDATE( 'Date' [Date] ))
Scenario: At least one of the balance sheet reports in the quarterly reporting package must show the ending balances for the quarter, as well as for the previous quarter.
DATESQTD returns a table that contains a column of the dates for the quarter to date, in the current context.
rence:
https://docs.microsoft.com/en-us/dax/datesqtd-function-dax
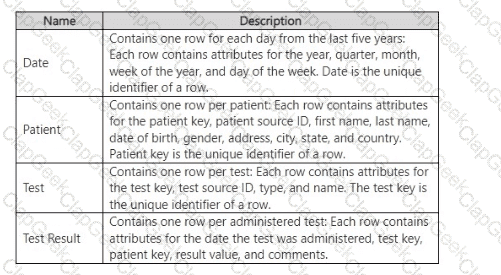
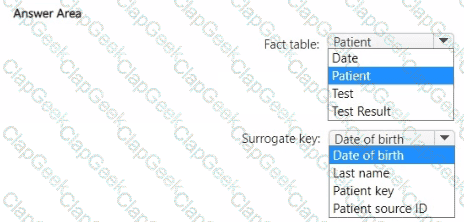
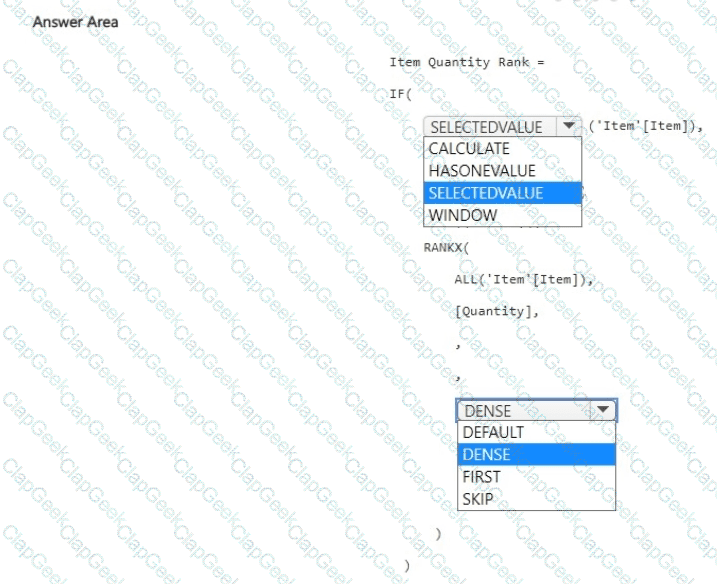
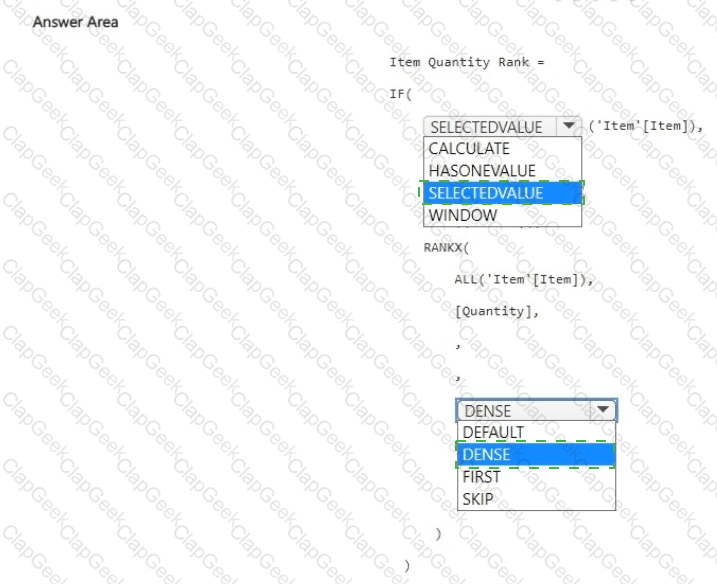
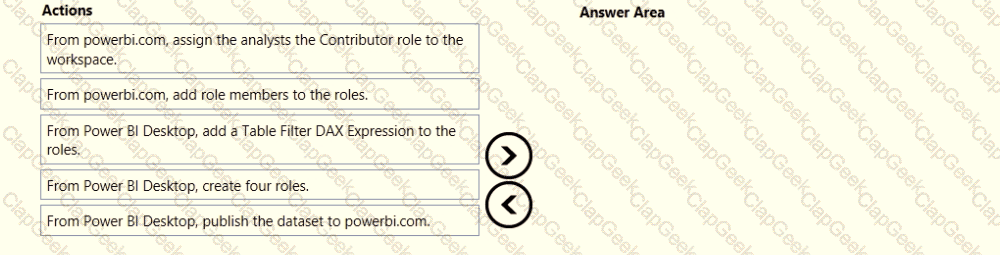
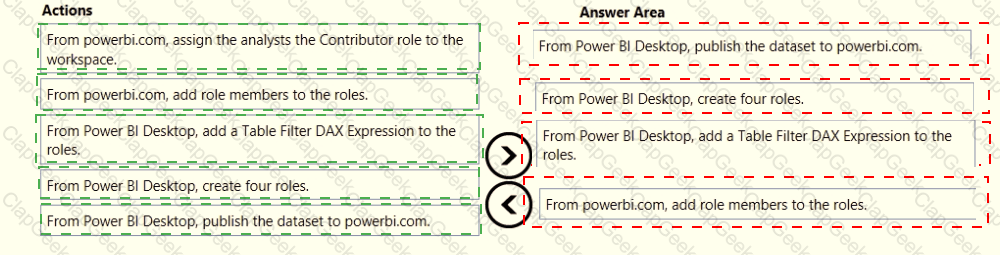
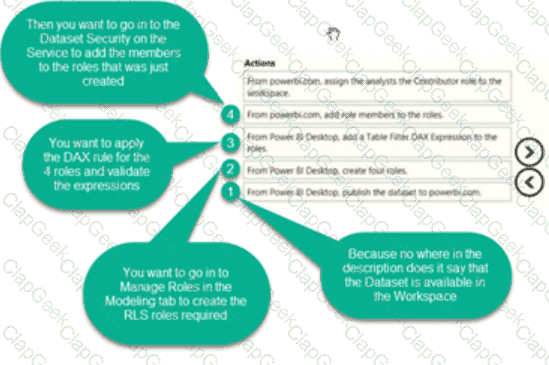
Once the profit and loss dataset is created, which four actions should you perform in sequence to ensure that the business unit analysts see the appropriate profit and loss data? To answer, move the appropriate actions from the list of actions to the answer area and arrange them in the correct order.
https://docs.microsoft.com/en-us/power-bi/admin/service-admin-rls
https://docs.microsoft.com/en-us/power-bi/connect-data/service-datasets-build-permissions
Which two types of visualizations can be used in the balance sheet reports to meet the reporting goals? Each correct answer presents part of the solution.
NOTE: Each correct selection is worth one point.
a line chart that shows balances by quarter filtered to account categories that are long-term liabilities.
a clustered column chart that shows balances by date (x-axis) and account category (legend) withoutfilters.
a clustered column chart that shows balances by quarter filtered to account categories that are long-term liabilities.
a pie chart that shows balances by account category without filters.
a ribbon chart that shows balances by quarter and accounts in the legend.
https://docs.microsoft.com/en-us/power-bi/visuals/power-bi-visualization-types-for-reports-and-q-and-a
You need to recommend a strategy to consistently define the business unit, department, and product category data and make the data usable across reports.
What should you recommend?
Create a shared dataset for each standardized entity.
Create dataflows for the standardized data and make the dataflows available for use in all imported datasets.
For every report, create and use a single shared dataset that contains the standardized data.
For the three entities, create exports of the data from the Power Bl model to Excel and store the data in Microsoft OneDrive for others to use as a source.
What should you create to meet the reporting requirements of the sales department?
a measure that uses a formula of SUM (Sales [sales_id])
a calculated column that use a formula of COUNTA(sales [sales_id])
a measure that uses a formula of COUNTROWS (Sales)
a calculated column that uses a formula of SUM (Sales [sales_id])
The sale department requires reports that contain the number of sales transactions.
The COUNTROWS function counts the number of rows in the specified table, or in a table defined by an expression.
You need to provide a solution to provide the sales managers with the required access.
What should you include in the solution?
Create a security role that has a table filter on the Sales_Manager table whereusername = UserName()
Create a security role that has a table filter on the Region_Manager table wheresales_manager_id = UserPrincipalName().
Create a security role that has a table filter on the Sales_Manager table wherename = UserName().
Create a security role that has a table filter on the Sales_Manager table whereusername = sales_manager_id.
https://powerbi.microsoft.com/en-us/blog/using-username-in-dax-with-row-level-security/
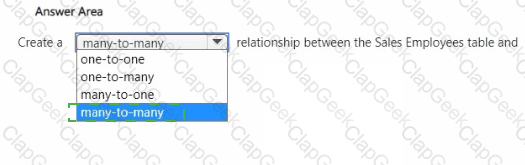
You need to create a relationship in the dataset for RLS.
What should you do? To answer, select the appropriate options in the answer area.
NOTE: Each correct selection is worth one point.
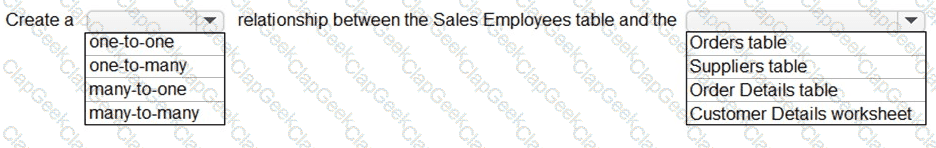
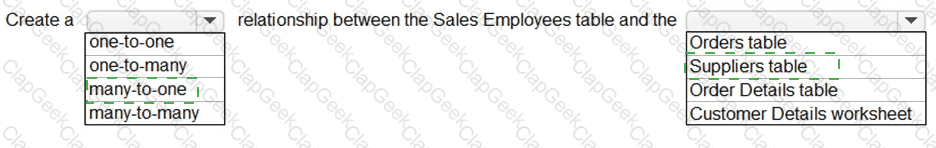
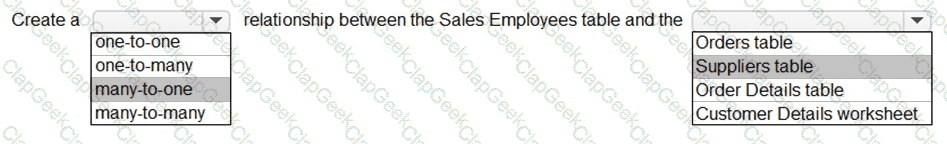
Box 1: many-to-one
Each employee in the Sales Employees table is assigned to one sales region. Multiple employees can be assigned to each region.
The Suppliers table has a Region column.
Box 2: Suppliers table
You need to create a relationship in the data model for RLS.
What should you do? To answer, select the appropriate options in the answer area.
NOTE: Each correct selection is worth one point.

You need to create the semantic model.
Which storage mode should you use for the tables in the semantic model?
live connection
Dual
Import
DirectQuery
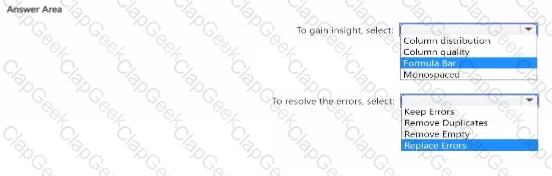
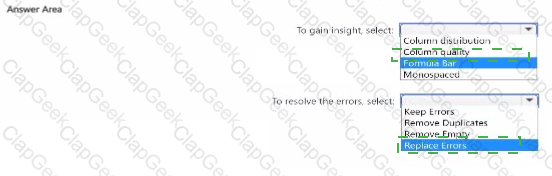
You need to create the On-Time Shipping report. The report must include a visualization that shows the percentage of late orders.
Which type of visualization should you create?
bar chart
scatterplot
pie chart
Scenario: The On-Time Shipping report will show the following metrics for a selected shipping month or quarter:
The percentage of orders that were shipped late by country and shipping region
Customers that had multiple late shipments during the last quarter
Note: Bar and column charts are some of the most widely used visualization charts in Power BI. They can be used for one or multiple categories. Both these chart types represent data with rectangular bars, where the size of the bar is proportional to the magnitude of data values.
The difference between the two is that if the rectangles are stacked horizontally, it is called a bar chart. If the rectangles are vertically aligned, it is called a column chart.
You need to create a solution to meet the notification requirements of the warehouse shipping department.
What should you do? To answer, select the appropriate options in the answer area.
NOTE: Each correct select is worth one point:


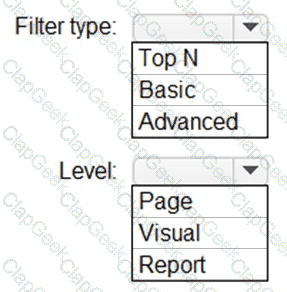
You need to create the Top Customers report.
Which type of filter should you use, and at which level should you apply the filter? To answer, select the appropriate options in the answer area.
NOTE: Each correct selection is worth one point.
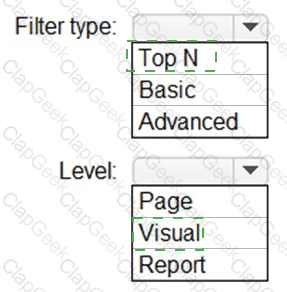
Box 1: Top N
Scenario: The Top Customers report will show the top 20 customers based on the highest sales amounts in a selected order month or quarter, product category, and sales region.
Once you drag to SKU to Visual level filter you should get Top N option
Note: The two most common filter types: automatic and manual.
Then there are more advanced filters.
Box 2: Visual
Once you drag to SKU to Visual level filter you should get Top N option.
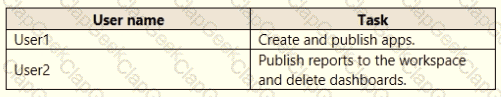
You need to configure access for the sales department users. The solution must me meet the security requirements. What should you do?
Add the sales department as a member of the reports workspace
Add the Azure Active Directory group of the sales department as an Admin of the reports workspace.
Distribute an app to the users in the Azure Active Directory group of the sales department.
Share each report to the Azure Active Directory group of the sales department.
You need to design the data model to meet the report requirements.
What should you do in Power BI Desktop?
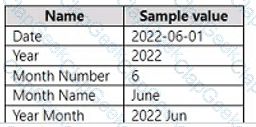
From Power Query, use a DAX expression to add columns to the Orders table to calculate the calendar quarter of the OrderDate column, the calendar month of the OrderDate column, the calendar quarter of the ShippedDate column, and the calendar month of the ShippedDate column.
From Power Query, add columns to the Orders table to calculate the calendar quarter and the calendar month of the OrderDate column.
From Power Bl Desktop, use the Auto date/time option when creating the reports.
From Power Query, add a date table. Create an active relationship to the OrderDate column in the Orders table and an inactive relationship to the ShippedDate column in the Orders table.
Use Power Query to calculate calendar quarter and calendar month.
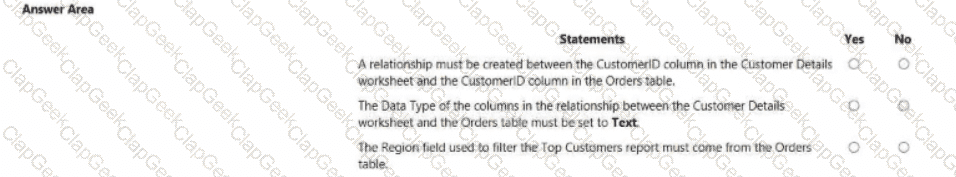
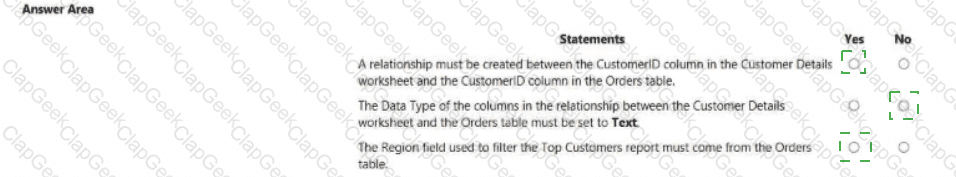
Scenario:
A single dataset must support all three reports:
- The Top Customers report will show the top 20 customers based on the highest sales amounts in a selected order month or quarter, product category, and sales region.
- The Top Products report will show the top 20 products based on the highest sales amounts sold in a selected order month or quarter, sales region, and product category.
The data model must minimize the size of the dataset as much as possible, while meeting the report requirements and the technical requirements.
You use Power Query to import two tables named Order Header and Order Details from an Azure SQL database. The Order Header table relates to the Order Details table by using a column named Order ID in each table.
You need to combine the tables into a single query that contains the unique columns of each table.
What should you select in Power Query Editor?
Merge queries
Append queries
Combine files
You publish the dataset to powerbi.com.
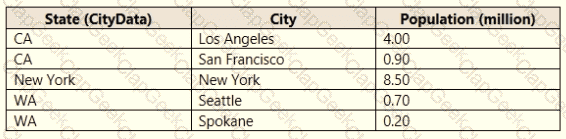
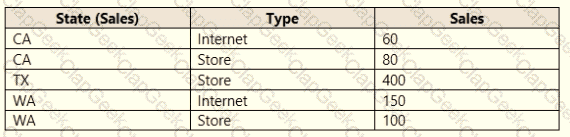
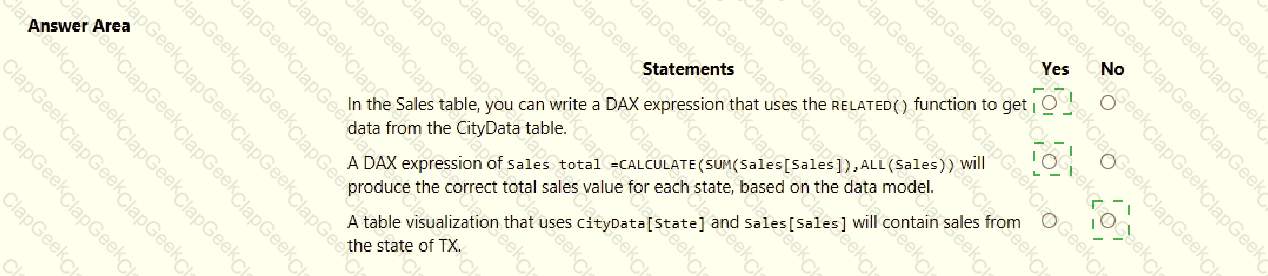
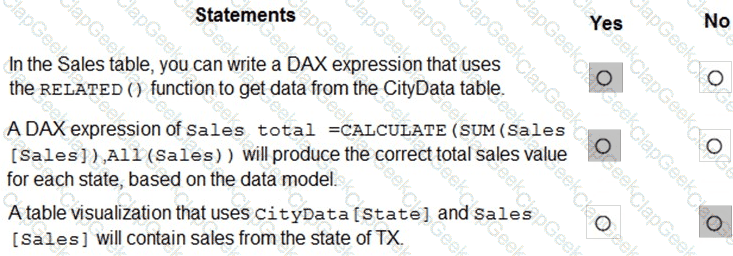
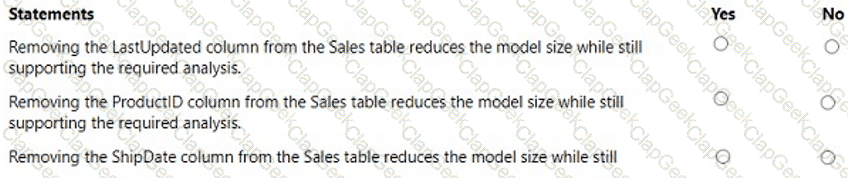
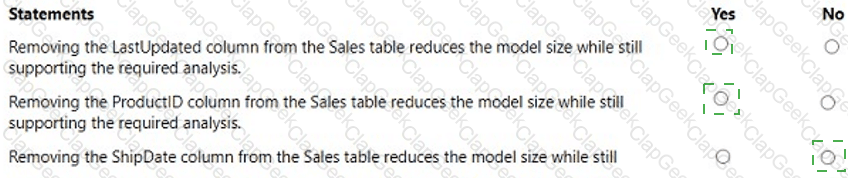
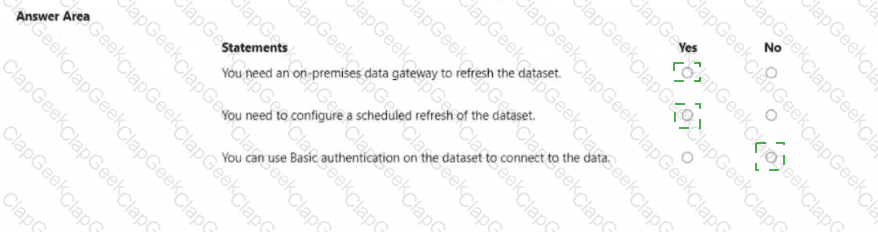
For each of the following statements, select Yes if the statement is true. Otherwise, select No.
NOTE: Each correct selection is worth one point.

You need to minimize me size of the dataset. The solution must meet the report requirements What should you do?
Change lite OrderlD column in the Orders table to the text data type.
Filter out discontinued products while importing the Product table.
Remove the QuantityPerUnit column from the Products table
Group the Categories table by the CategorylD column.
You merge data from Sales.Region, Region_Manager, Sales_Manager, and Manager into a single table named Region. What should you do next to meet the reporting requirements of the executives?
Apply row-level security (RLS) to the Region table based on the sales manager username.
Configure a bi-directional relationship between Region and Sales.Region.
Create a DAX calculated column that retrieves the region manager from the Weekly.Returns table based on the sales.regionjd column.
In the Region table, create a hierarchy that has the manager name, and then the sales manager name.
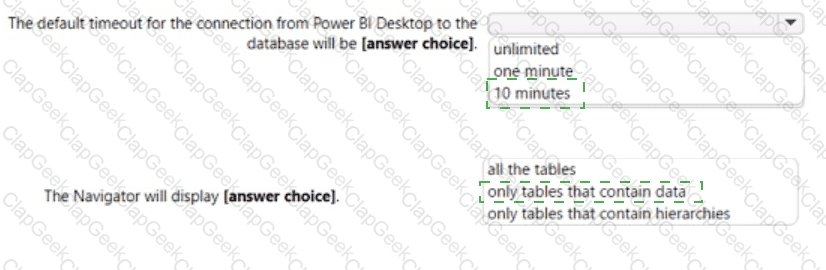
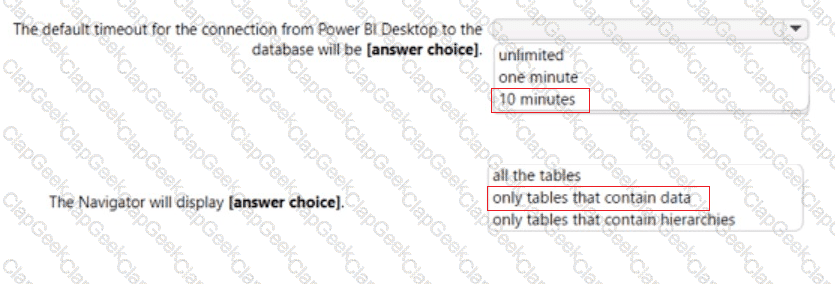
You need to get data from the Microsoft SQL Server tables. What should you use to configure the connection'
import that uses a Microsoft account
DirectQuery that uses the end-user s credentials
DirectQuery that uses a database credential
Import that uses a database credential
You need to minimize the size of the semantic model. The solution must meet the report requirements.
What should you do?
Filter out discontinued products while importing the Products table.
Group the Categories table by the CategorylD column.
Change the OrderlD column in the Orders table to the Text data type.
Remove the QuantityPerUnit column from the Products table.
You need to create a measure that will return the percentage of late orders.
How should you complete the DAX expression? To answer, select the appropriate options in the answer area.
NOTE: Each correct selection is worth one point.
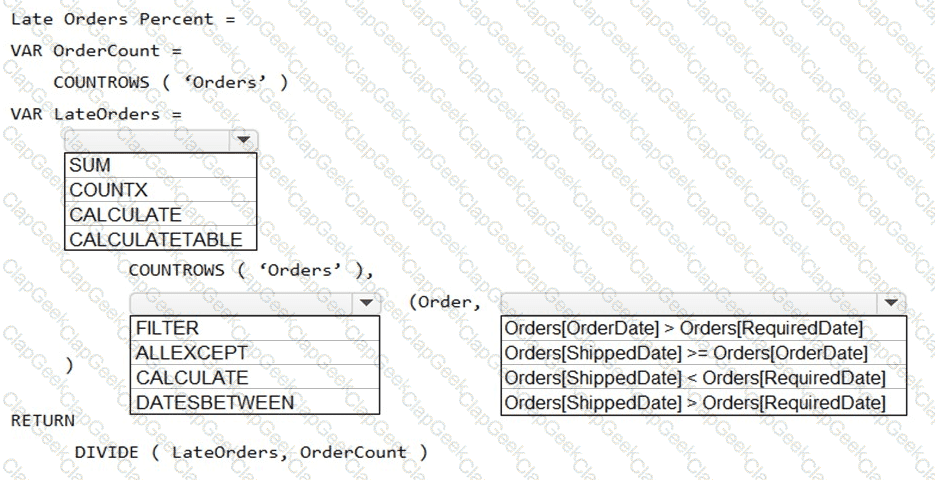
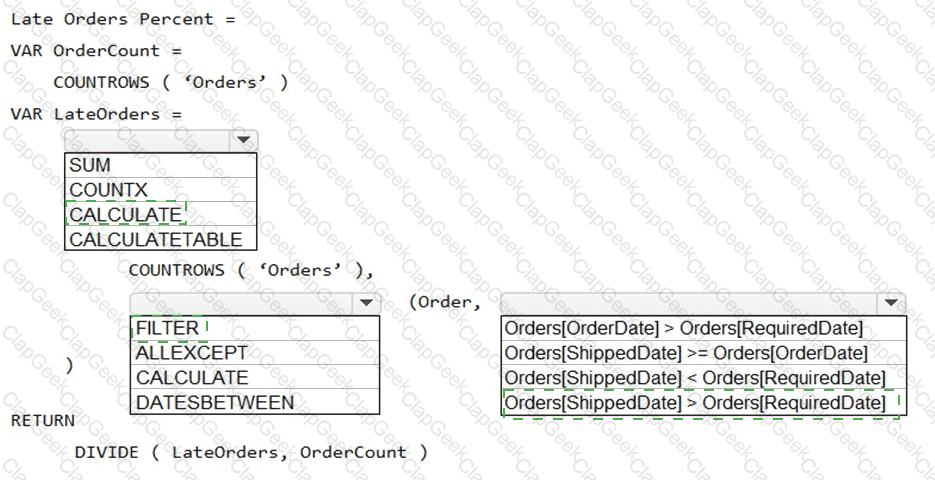
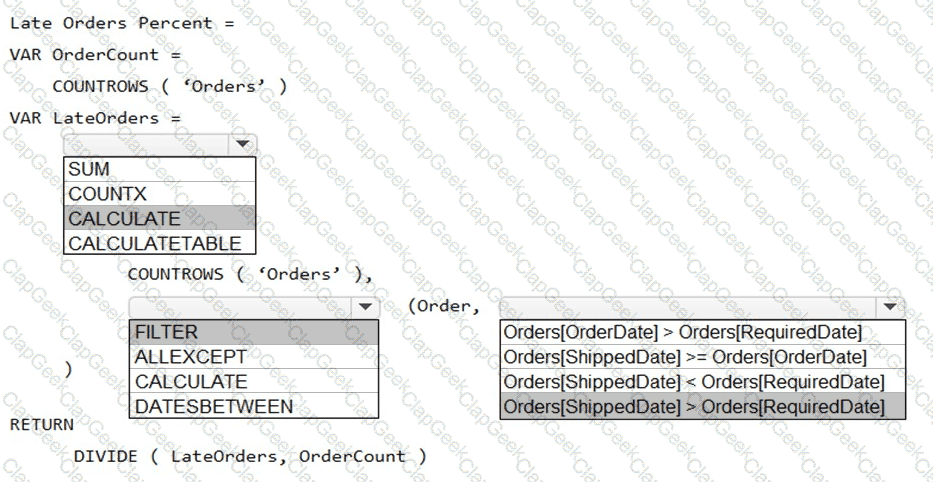
Box 1: CALCULATE
CALCULATE evaluates an expression in a modified filter context.
Syntax: CALCULATE(
Expression - The expression to be evaluated.
filter1, filter2,… (Optional) Boolean expressions or table expressions that defines filters, or filter modifier functions.
Box 2: FILTER
FILTER returns a table that represents a subset of another table or expression.
Syntax: FILTER(