In measurement system analysis, both the 10:1 rule and the 4:1 rule are based on the
Which of the following methods is used to identify values that can cause invalid inferences?
Which of the following training delivery methods focuses on a critical incident and how to respond to a specific event, situation, or condition?
The following samples were drawn from the same stable process. If no other information is available, what estimated average (μ) and standard deviation (σ) should be used for the population?
Sample 1: n = 12, X̄ = 14.98, s = 1.54
Sample 2: n = 45, X̄ = 15.02, s = 1.49
Which of the following formulas represents the standard deviation of the sampling distribution of the sample mean?
The following table shows the sales rates and respective salaries for members of a team.
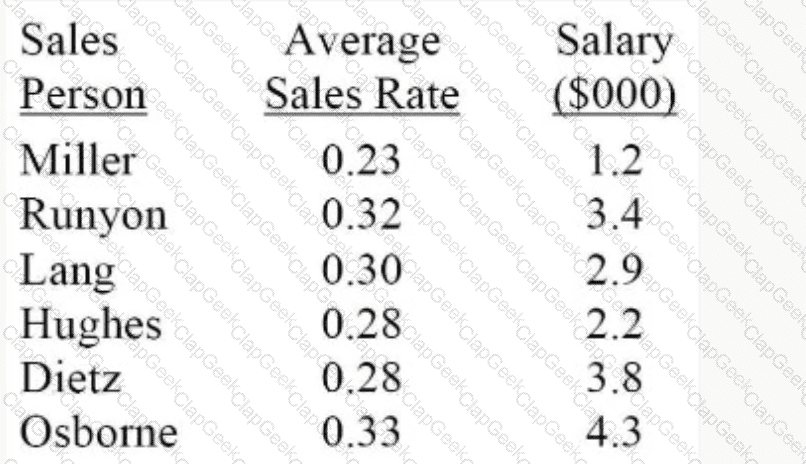
Which of the following descriptions accurately represents the correlation between sales rate and salary for the entire team?
A company is reviewing four processes for improvement, and each process has a unique characteristic.
Process A impacts other schedules or requirements.
Process B improvements will not disrupt delivery.
Process C is related to the organization’s strategic plan.
Process D is used in various areas of the organization.
Which of these processes should take priority over the others?
Which of the following tools can be used to break down the tasks for implementing a strategic objective?
A company that is selecting a Six Sigma project from four potential projects should select the one that
During the design stage of a product or service, functional requirements are developed in order to
A team should use a prioritization matrix in order to respond effectively to which of the following situations?
Which of the following control charts should a manufacturer use to measure the number of products rejected due to nonconformance?
Please refer to the following line balance chart.
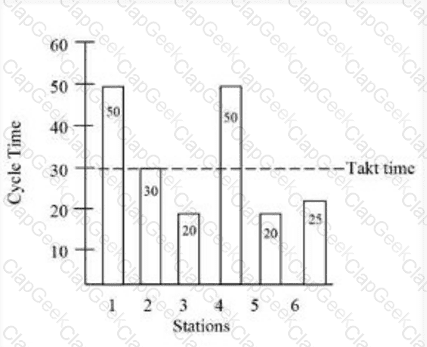
Which station is meeting customer demand?
When an organization is identifying a Six Sigma project, a Black Belt should work with area management to determine the
A Black Belt is testing the wear of two different brands of tires to be purchased for a truck fleet. Ten trucks have two tires of each type installed. The trucks are driven for 20,000 miles with tire rotation every 5,000 miles. Which of the following tests should the Black Belt use to assess the results of the wear test?
Which of the following conditions is a typical organizational roadblock to a Six Sigma program?
Which of the following formulas is a property of sampling distribution as defined by the central limit theorem?
The following control chart was developed by a continuous improvement team.

The process in this chart shows a pattern known as
An acquisition team is auditing a business they are considering purchasing. They visit the target company and assess its operations on a series of metrics to determine the current state and compare it to a desired condition to make a determination of their condition. What quality tool is the acquisition team using?
Creating a training plan to sustain an improved process will ensure that the new process
A company’s document control area has 4 hours available to issue documents during an 8-hour workday. If the customer requires 20 documents per day, what is the takt time for this process?
The following interaction plot was developed for a process.
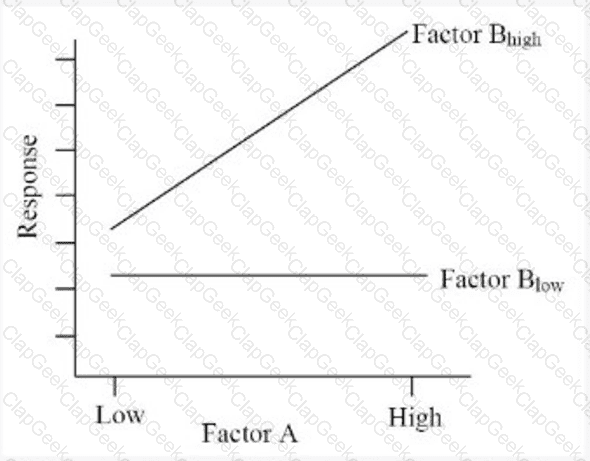
Which factor setting would result in the response being least sensitive to changes in Factor A?
Gauge traceability requires an unbroken chain of calibrations from each gauge to
One of the most effective ways of identifying a product’s internal and external customers is to
Which of the following is the best tool to use to identify the specific tasks needed to complete a project?
The best time to get stakeholder support and commitment for a project is immediately after the
Which of the following systems uses signals to communicate the need for units or components?
Which of the following factors within an organization would most likely reduce the likelihood that Six Sigma projects will be successfully implemented?
What does the “X” signify for countermeasures on a process decision program chart?
Design of experiments (DOE) trials that are made under identical conditions represent which of the following concepts?
A 1/3 fractional factorial DOE with 3 levels, 4 factors, and 3 replicates requires how many runs?
When measurements are made by reference to a graduated scale, the resulting data are referred to as
Which of the following analyses is used to classify observations into two or more groups when there are multiple known groups?
Rank in order, from first to last, the following steps to conducting a hypothesis test.
Draw a conclusion about the test
Specify the parameter to be tested
Determine the test statistic to use
Calculate the critical values
Define the rejection criteria
Which of the following elements should be included with the documentation for a process failure mode and effects analysis (PFMEA)?
Which of the following levels of the work breakdown structure (WBS) includes an explanation of the purpose of the project?
There has been an increase in the measurement of hazardous materials being detected at a transportation terminus over the last 3 months. The terminus is located in an area that has been unusually rainy during the same period. Which of the following tools should be used to determine whether there is a relationship between the chemical hazards and the rainfall?
On a Six Sigma team, which of the following members should take the lead in helping to resolve team conflict?
A speaker should use which of the following listening techniques when making a presentation to a group?
In a process improvement project, a Six Sigma Black Belt measures discrete data including error counts in the final product. This discrete data can also be referred to as
The primary reason for identifying both the internal and external customers of a process is to
When team members are satisfied with the team’s progress and have close attachments to one another, the team is typically at what stage of development?
Which of the following roles is responsible for reviewing and approving any changes to a Six Sigma project charter?
Which of the following tools begins at the point of failure and works back through the process to the components?
A credit approval process has a Cp = 1.33 with a mean of 120 minutes and a tolerance of ±10 minutes. What does the short-term standard deviation have to be in order to achieve a Cp = 1.67?
Upper management’s primary role in influencing the success of quality improvement projects is to
Which of the following tools focuses on maximizing equipment effectiveness throughout the life of the equipment?
Which of the following terms is defined as consistent bias values throughout the operating range of a gage?
The primary reason for calculating the appropriate sample size for a hypothesis test is
What type of team is encouraged to make its own decisions, establish its recognition system, and recruit its members?
A cause that contributes to excessive variation and is detectable using a control chart is referred to as
In a one-factor analysis of variance with five treatment groups, the sample sizes are [source text incomplete in the provided prompt]. How many degrees of freedom are there for the error term?
Which of the following tools could be used during the optimize phase of a DMADOV project?
Which of the following describes the two-level fractional-factorial design for studying k = N−1 variables in N runs, where N is a multiple of 4?
When developing a control chart, a team should monitor only those characteristics that
Which of the following is an example of an effective goal statement in a project charter?
Which of the following tools should be used to identify the source of a performance gap?

TESTED 06 Jul 2026